
Oil, Gold, Copper Stratospheric
I don't usually look much at commodities in this blog, but they've been going so insane lately it's worth a look. Remember that clicking any image makes a much larger image show up for greater detail.
Gold has been the talk of the town for a couple of years now. Here is a chart going back to the late 1970s, which includes the run up to about $875. Judging from the Fibonaccis, it seems that gold is well on its way to the $690 level.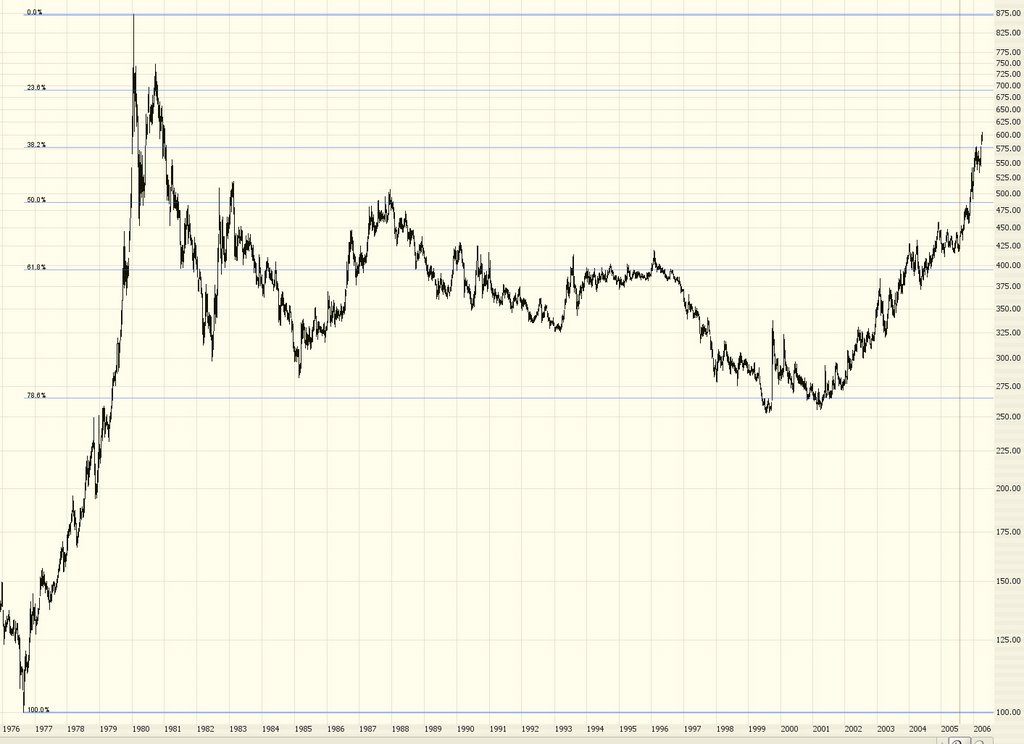
But the real show is in copper, which is reaching levels never seen before. This kind of action would be the equivalent of Gold pushing past $2,000 per ounce. Fellow technician Michael Kahn makes a strong case for copper's rise to point to big-time inflation in our future.
Lastly, crude oil has also been pushing into never-before-seen levels. Will it cross into $80? Impossible to say. My recent bearishness on the oil services sector has not served me well, as crude's push higher and higher provides excellent support to bulls of these stocks.
Returning to the stock market......it seems we'll finally have a good reason for the market to snap out of its indecision....earnings! This week there will be hundreds of earnings reports, including IBM, Motorola, and Yahoo on Tuesday, Apple, JP Morgan, and Intel on Wednesday, and Google (plus an ungodly number of others...) on Thursday. This should provide for a lot of fireworks as the outlook on these companies clears.
The Dow 30 continues to be weak, clearing falling below and closing below the short-term trendline. The market is not clearly bearish until and unless it crosses below the medium-term trendline shown beneath it. The circled area indicates the close below the short-term trendline.
A few weeks ago, the stock market did make an attempt to push higher, but as you can see in the chart below, it was a flimsy attempt. This particular index is the American Major Markets ($XMI), and although it did cross above the resistance line here, the crossover was weak and short-lived. It has since slunked lower, yielding doubt on whether this pattern will ever truly become bullish.
One specific short suggestion from a reader of this blog is Kinder Morgan (KMI), which has a nice pattern, as shown below. Both the major ascending trendline has been broken and a good-looking topping pattern (which will be confirmed if it crosses the horizontal line shown) are in place.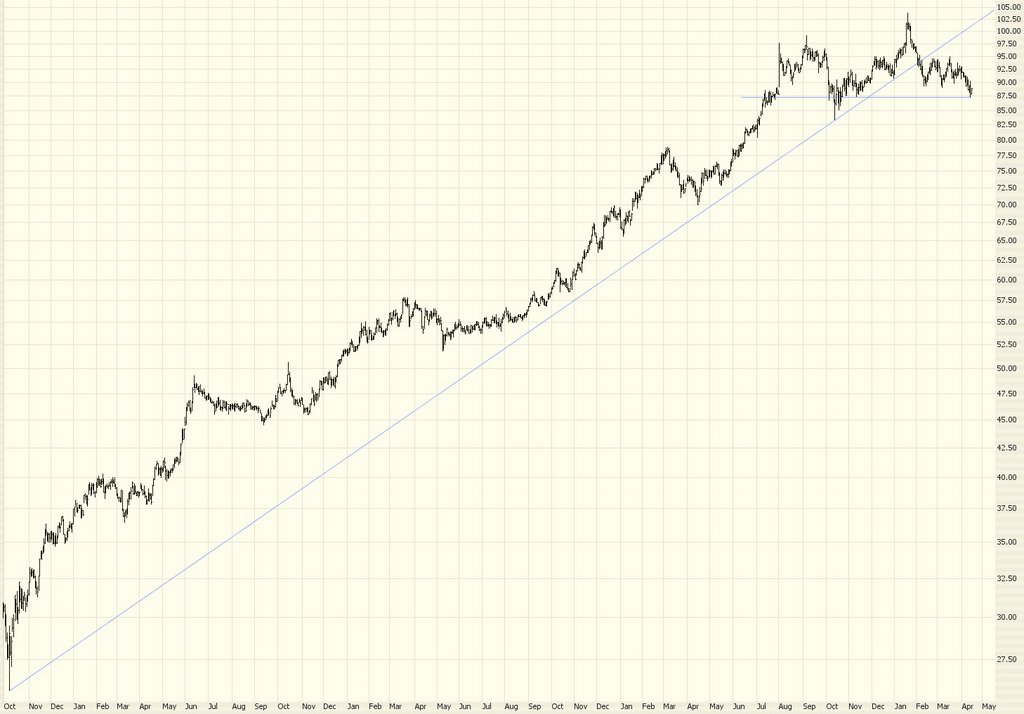
No comments:
Post a Comment