Fibonacci Friendly Apple
First off, what in God's name is happening in the market today? It's acting hysterical! I admit I don't watch CNBC, but is there some wild rumor flying around? The market's been higher all day, but at one point it absolutely strapped on turbo blasters and soared higher, only to flip around and given back a lot of the recent gain (make no mistake, it's still up big-time today, but it's acting like a maniac).
Anyway, that's not what this post was about. I wanted to offer an example of what I call a Fibonacci friendly stock. In this case, Apple Computer (AAPL).
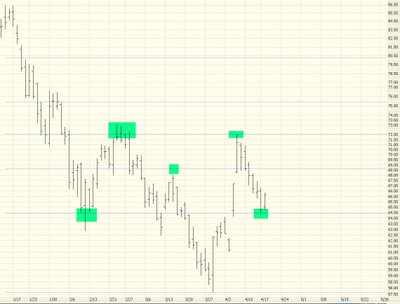
Not long ago, I pointed out that Apple was at a resistance point and that it would make a fairly safe short. This turned out well. One reader sent me a nice note saying he had made 40% on the puts for this based on the suggestion. Anyway, as you can see from the daily chart below, AAPL does tend to "cling" and "bounce off" its resistance lines. I've highlighted some areas in particular.
What's cool about these is that they make great exit points too. Take a look at this graph, which is the minute-by-minute chart of AAPL over the recent past:
I've marked five levels on the intraday chart where AAPL does this "bounce." For the recent short suggestion, the ideal time to close it out would have been the area marked as "5". As you can see, it touched the resistance line perfect before flipping around higher.
Fibs definitely don't work with all securities, but when you find one that is Fibonacci friendly, it tends to consistently behave that way.

2 comments:
So the market did take support and once again confirmed that this baby loves good news.
My positions are still very light and want to see the 11430 breakout on the DJIA before my bullish commitment increases.
As for AAPL, a straddle is the best bet at this price with an anticipated price movement of 15% in either direction in the coming days. I am still bullish on this stock for now.
My statement Sunday night was "I think we’re seeing a buying opportunity!"
I also wrote "THE key action of the last week was the violation of the October – March uptrend line. The index busted that line on Tuesday and then fell about a full percent, which, in today’s non-volatile times, counts as a “trouncing.” With that violation, we also violated the 1295-ish horizontal support. The index fell to the 50 DMA and stuck there. All the action of last week took place on low volume, except for Tuesday’s fall, which had average volume, and the week was very lightly traded. We have two alternate interpretations of this event.
Interpretation #1: The long-awaited crash is here, and the penetration of 1300-1310 was the elusive “blow-off rally,” and the action Monday will be a continuation of the fall.
Interpretation #2: The violation of trendlines triggered program selling, which took over due to the light volume, and either (a) Monday will be very bullish or (b) we will need a catalyst to kick us back over 1295-ish."
I believe it was #2(a), but I was off by a day.
Post a Comment