
Good Charts for Good Friday
Happy three-day weekend, everyone. No sermons today. Just a few good charts.
First up is AutoDesk. I mentioned this one a few days ago and a "blast from the past." It looks like it's losing ground (which is good, since it's a short recommendation, as all of these are). If this really starts to fall, the key question is whether it will fall all the way down to the lowest trendline you see or not. I'll leave that judgment for later.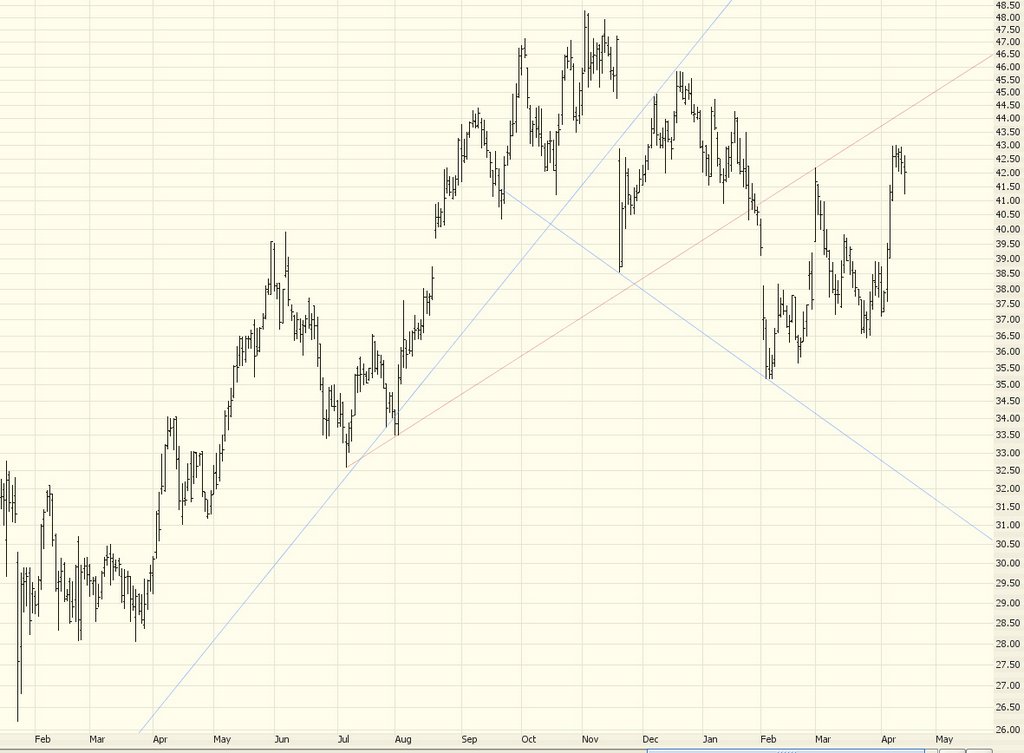
ESRX is a high-risk/high-reward trade. It's in a pretty decent topping pattern, and I'd suggest using that descending trendline (as opposed to a neckline) as my stop-loss point.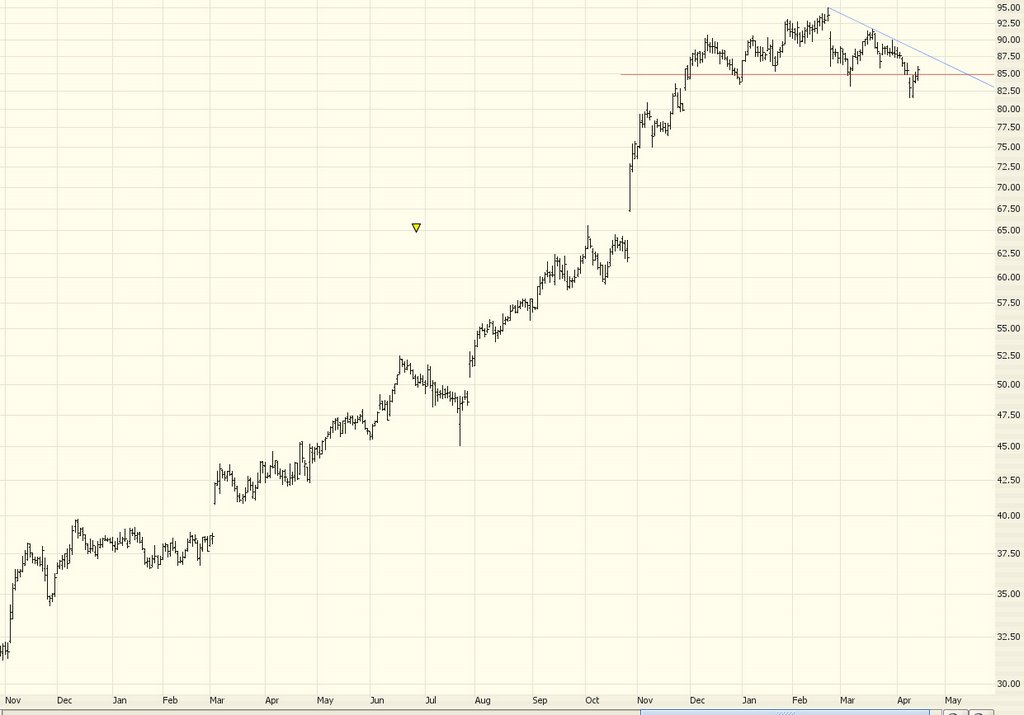
Perennial favorite GOOG looks like it's weakening after a stury push upward over the past six weeks or so. The Fibonaccis are helpful guides, but obviously not rock solid lines in the sand.
Holly (HOC), although a big winner over the past year for the bulls, is so lofty it represents a relatively low-risk short position, as dictated by the trendline you see. It seems to have peaked for now.
Finally, the utility ETF whose symbol is UTH is continuing to weaken, as I thought it would a couple of weeks back. The green highlight indicates my earlier prediction for how far it might fall.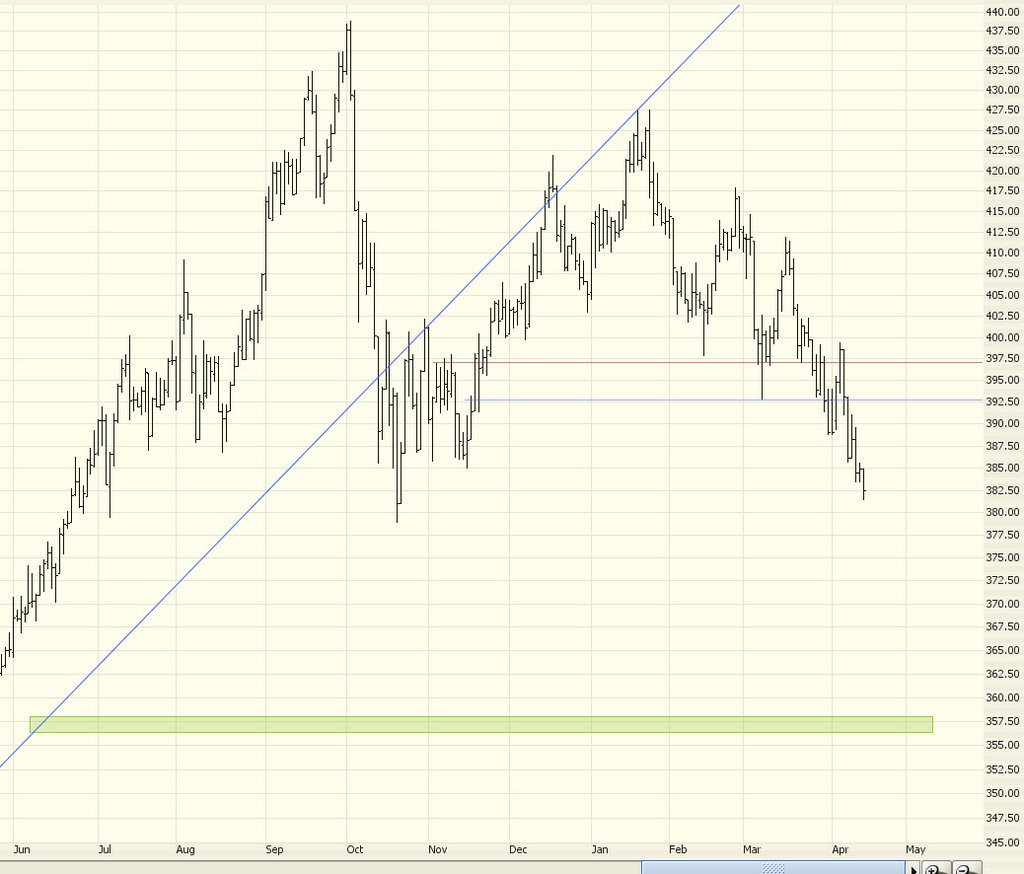
3 comments:
You're leaving out the important fact that when I made that suggestion, I gave a specific stop-loss order, which would have been executed. And if you believe charts have no predictive value, I have no idea why you're reading this blog.
I'd be careful with Google's earnings coming up on the 20th(the day before April expiration). It could be the catalyst to move back down to where it was, but who knows...could also raise back up into the stratosphere!
Happy Easter!
GOOG & AAPL both look like they are ready to rally up to their previous highs. What needs to be seen, is if they break out, or run out of steam. For both GOOG & APPL to turn bearish, they need to breach 330 & 57 respectively.
Post a Comment