
Thursday, May 11, 2006

Blowing the Froth Off

Yesterday I wrote, "Below is the Dow 30. I could make all kinds of technical jargon, but I will offer only this: the market is really, really, really extended. It will not keep going up every day, people. Promise."

Well, promise kept. All the indices got beat up. The NASDAQ 100 was down 2.2%. The Dow was down 142 points. I have embraced a sober view of my bearishness, however. As the chart shows below, there are plenty of times the market has pushed up against its resistance trendline, only to ultimately push higher.
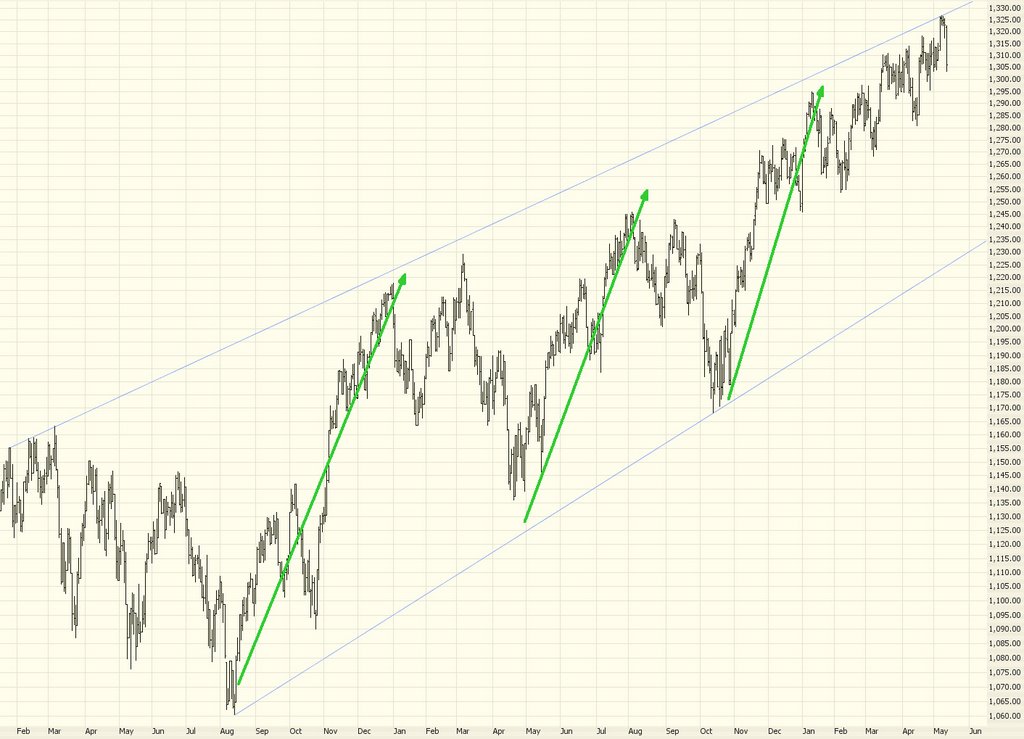

So I'm not going to be beating any "the market is crashing!" drum. It's down today, and that's great. And I hope it goes down a lot more. But there is no sea change in the market's direction yet. It could consolidate and push inexplicably higher yet again.

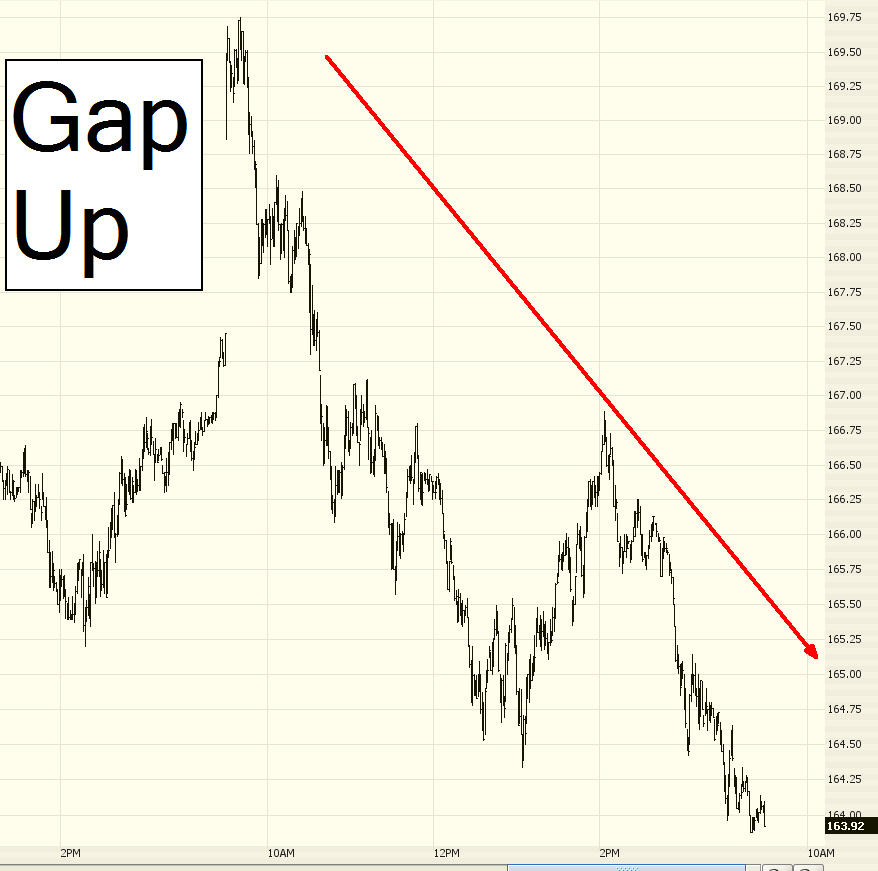
The oil sector threw me for a bit of a loop this morning. I got instantly stopped out of my OIH position at the open this morning (it gapped up) only to see OIH fall the rest of the day. Crude oil might have topped out, but it's very hard to say. A day like today would definitely give pause to the energy bulls.

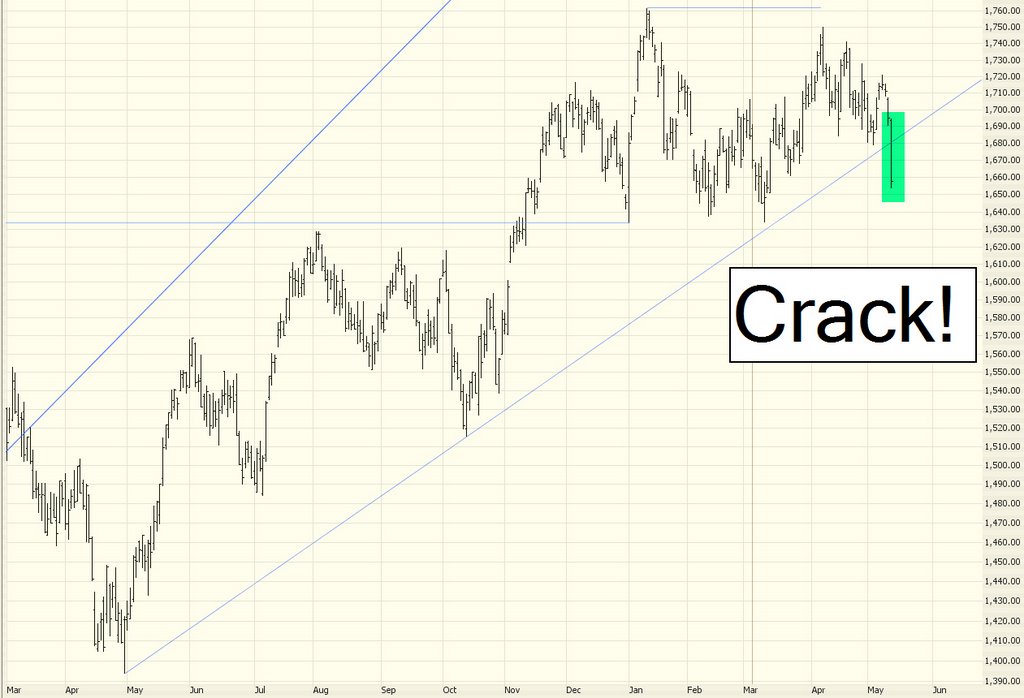
The NASDAQ is clearly the weakest index in the U.S. these days, and the $NDX has finally snapped below its supporting trendline. This is great news for the bears. As you can see, this trendline goes a way back, so this is a pretty good signal of a change for the better.

Take a look at stock CHRW as a short candidate with a stop of $50.25. I like how it's retraced part of its recent fall and seems to be re-weakening.


The same can be applied to E*Trade (ET). I usually don't buy puts on stocks this inexpensive, but the trend change seems so clear (and its ascent so mighty) that I made an exception here.


Not a recommendation per se, but one chart I wanted to offer as a great example of "lower highs and lower lowers" is AIG, which got whacked today. It also is very trendline-compliant. This is a really beautiful graph from a technician's perspective.


One last, random comment. I'm just curious - can someone tell me who trades Time Warner? And why? This has got to be the most boring chart in the world, yet it trade millions of shares a day. Do you get a free sandwich or something if you place a trade on TWX? I'm just wondering, because the nearly-flat graph below represents about three years of activity.

Wednesday, May 10, 2006

Extending the Overextension

The insanity surrounding "Fed day" has become so predictable it's perversely boring. It's the same old song - - from the open until 2:15 EST, the market doesn't do much of anything special. Then a snare drum rolls, the announcement is read, and the markets go stark raving mad for about 30 minutes. It's quite a spectacle.


Speaking of lunacy, here's an updated chart of perpetual riser Hansen Natural (HANS). This is a percentage chart. I don't touch this thing. I just watch in amazement. It's kind of hard to fathom that a niche player of energy drinks has a market capitalization approaching five billion dollars. This stock will fall hard one day, but I for one am not about to guess when or why!


As long as we're looking at insane charts, let's drink in the latest on copper:


......and gold:


Just to show you how loony things have become........I was speaking with my electrician about providing an electrical circuit to my back yard for some construction work going on. The electrical contractor emphasized that the bid was only good for one day, since the price of the wire was moving higher so rapidly, he could not rely on his own cost of materials. When your own electrician has to worry about commodity prices for a 100 foot piece of cable, you know things are bananas!

Below is the Dow 30. I could make all kinds of technical jargon, but I will offer only this: the market is really, really, really extended. It will not keep going up every day, people. Promise.


The NASDAQ 100 fell over 1% today, and as you can see from this chart, its attempt to bust out above its consolidation simply isn't going to happen. If it weakens further, it is at serious risk of cutting beneath a major supporting trendline.

Tuesday, May 09, 2006

A Couple of Buys While We Wait......

Really not much going on in the market to talk about. Yes, the Dow was up again, but it seems to be kind of acting on its own. Even though it moved up more than 50 points, the S&P 500 did nothing and the NASDAQ fell. So it seems the Dow is standing alone as the truly strong, consistent mover.

Looking back, my original short recommendation on Express Scripts (ESRX) was when the stock was at about $92. It has since fallen to about $70. The green shaded area, which I drew a long time ago, seems to have been achieved. That doesn't mean it won't go farther, but I'm proud to point out that the original price target was cleanly reached today.


One of the very few bullish looking patterns I see out there is Cirrus Logic (CRUS).


Another is Chipmos Technologies IMOS (IMOS), which is likewise in the semiconductor industry.


Hopefully tomorrow's Fed announcement will shake off some of this uncertainty. See you afterwards!