My Nude Pictures of Ernest Borgnine
Finally, a skosh of relief for the bears today (only those truly secure dare offer the word skosh in their blog). The market was down over 100 points several times today (but just a skosh) and wound up down 80. Freakishly, the QQQQ left the day unchanged.
In any case, I made some nice green on some intraday Russell 2000 option trades. I'm too war-weary from the past year to hold these suckers overnight, but I can at least say I like the current $INDU chart more than I did 24 hours ago:
The Russell 2000 (side question: has anyone found ANY other index with a reasonable bid/ask spread on the options?!) has been rather strong lately but edged down about half a percent today. No sea change by any means, but we take what we can get.
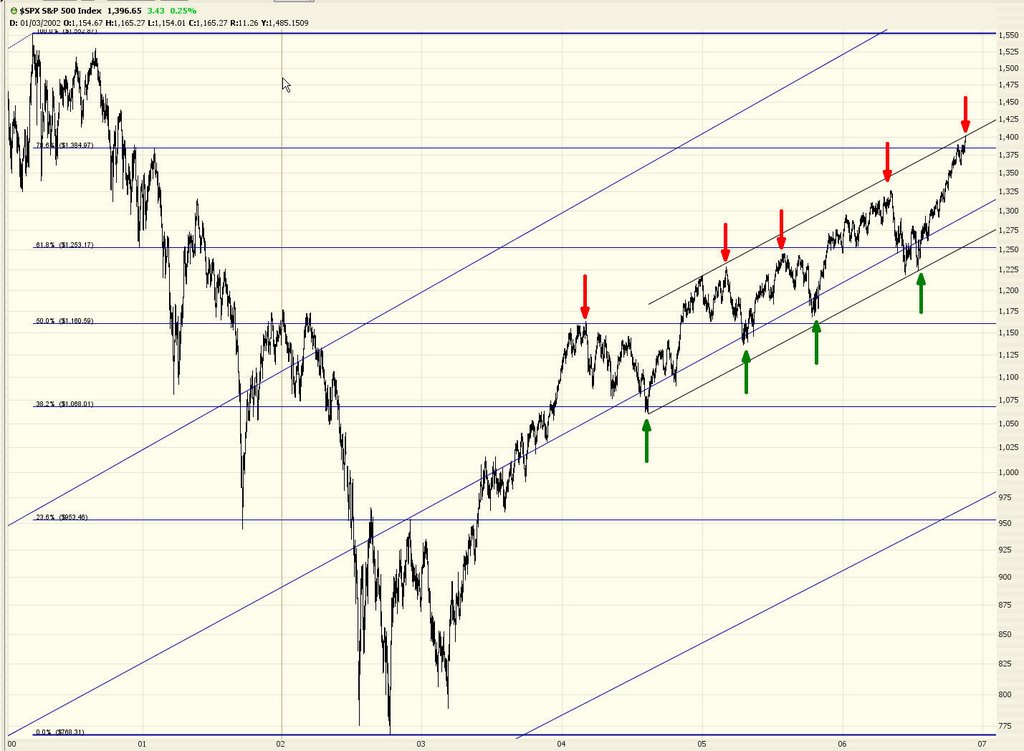
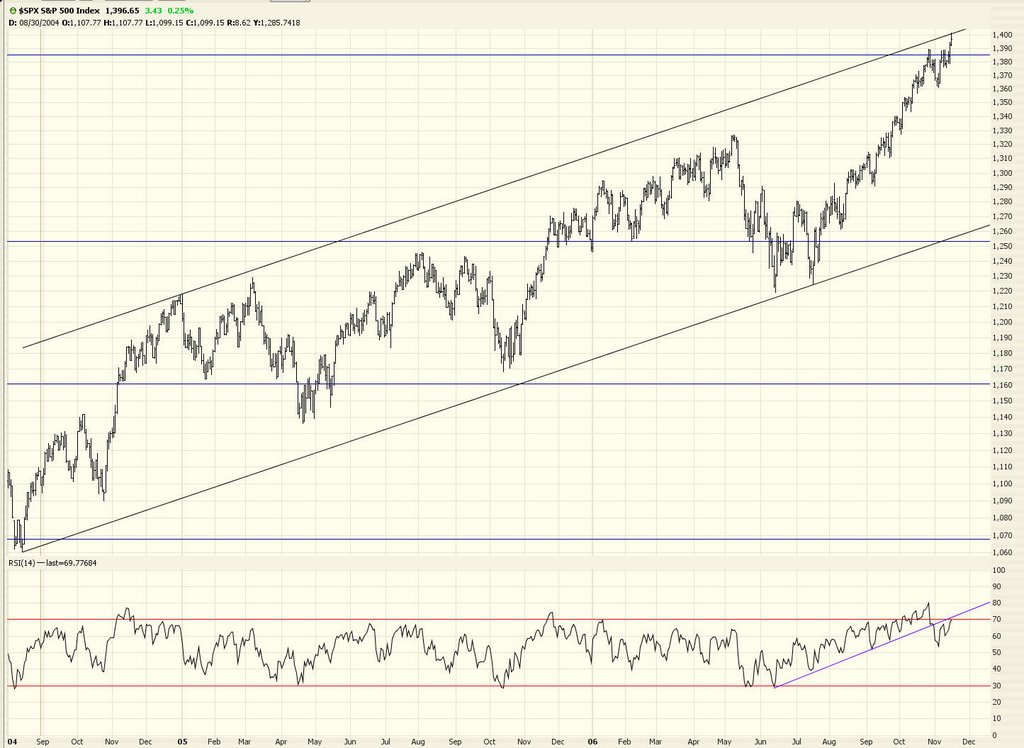
And, for good measure, here's the S&P 500:
I haven't put a chart up of the $UTIL for a while, but whether you've noticed or not, interest rates have been really pushing higher lately. (Remember those? Low interest rates? The reason the market's been so bullish.........remember?)Worldwide interest rates have been surging, relatively speaking. Gentle Ben's remarks today pushed them higher still.
My suggestion of Coach (COH) as a short is decent thus far.
I am short a lot of housing stocks. Today was a good day for those positions due to the interest rate movement. Essex (ESS) is particularly attractive.
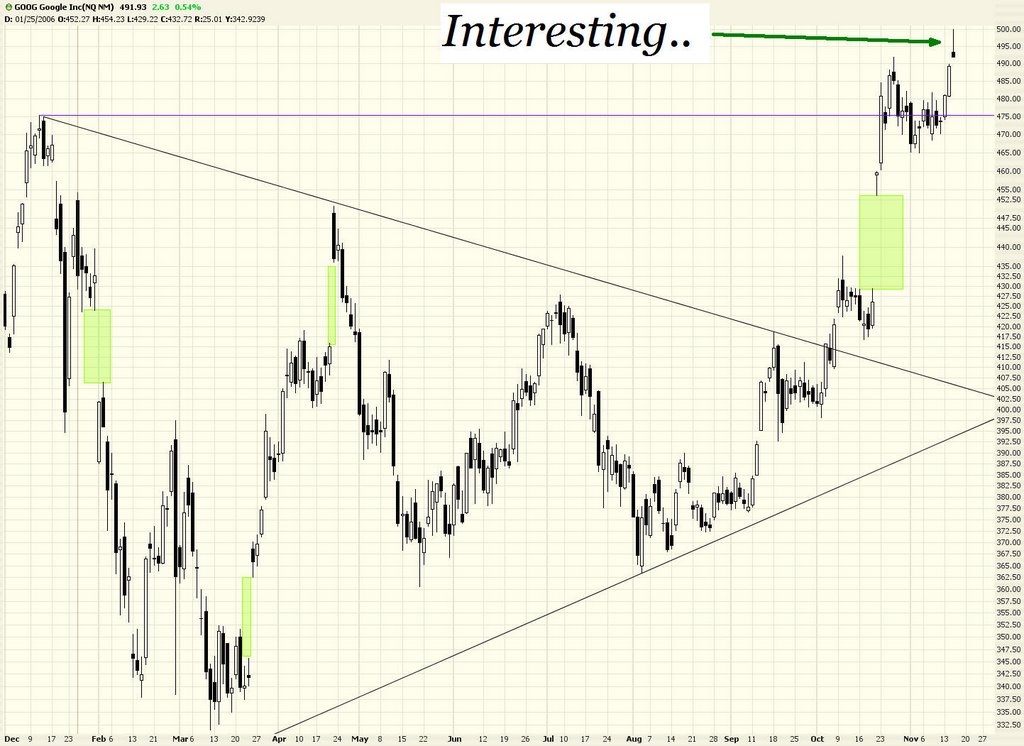
Just yesterday I said Google was a nice looking long position. Today (of all days, considering the market's weakness) it made a nice lifetime high. So - clink! - here's to another zillion dollars for all the adolescent Google zillionaires out there. I'm talking about their employees. Not you.
KRC is another sharp-looking housing short.
I've been charting the thirty components of the Dow Industrials recently, and 3M Corporation (MMM) is a favorite of mine. I've got some puts on this. Continued Dow weakness would be very kind to those.
Oh, and one last thing. JakeGint's pondering as to what "we" saw in George Carlin left me shocked. So here's another clip.