
Pain in 3-D
"That's why I'm looking this bull straight in the face and laughing at it. Savor the moment, pal. You're about to get wasted."
Whoops! I figured it out! I wasn't looking at a bull! I was looking at a mirror! My bad.
Well, look. Today hurt. It hurt bad. I got blasted out of a bunch of positions. And I notice the comments board has gone bananas. I don't even want to set foot into that place. It's probably like a bar fight by now.
But this is something to keep in mind - - I can deal with getting blown out of positions. But I don't hang on. That's why I say, over and over - always have a stop in place. Always! Take PNRA, for instance. I bought puts on it. Some people said I was wrong to do so. Turns out they were right. That's fine. I can deal with the loss. But if I had just hung on (past the circled point, where I got pushed out of the position), now that would be stupid.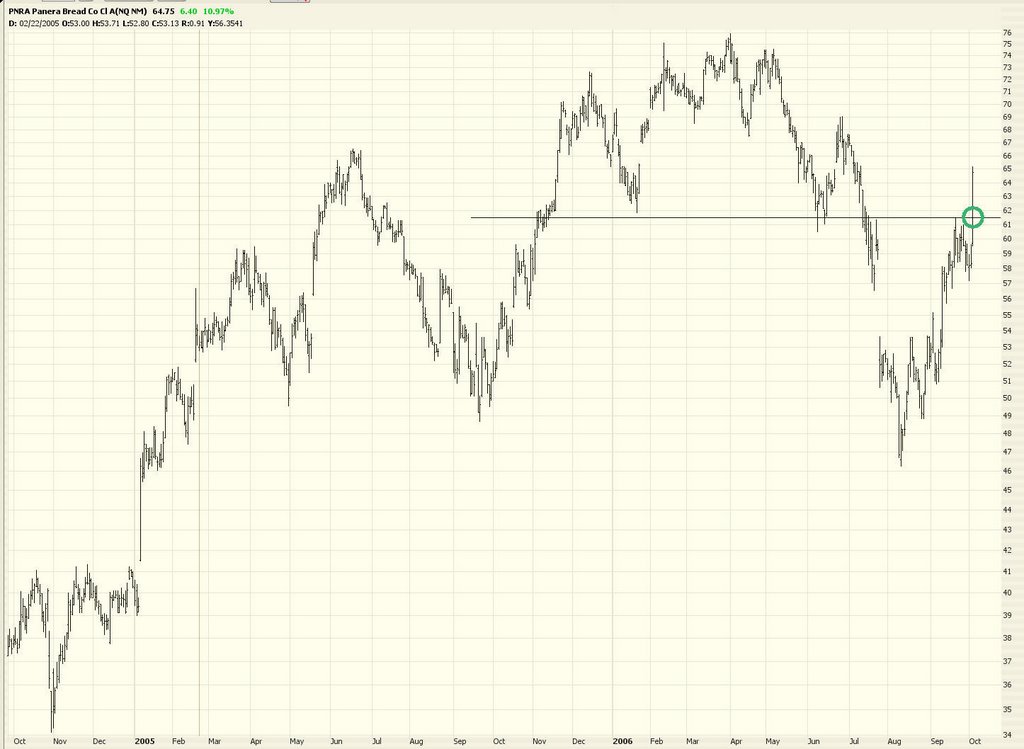
As enamored as I've been with OIH shorts, I closed out my energy shorts today, including OIH. I think the selling in energy and gold is really overdone. There are hammer patterns all over the place today!
So I'm going to blow away my reputation as a permabear by offering what I think are interesting stocks to consider buying (yes, buying) or buying calls on (that's right - I said calls). I still have lots of put positions, and plenty of shorts. But there's no denying the force of buying at this point. (By the way, the meaning of the 3D in my subject title today means 3 Digits - - a triple point rise in the Dow). And so I offer these tickers for your consideration. The stop prices should be pretty obvious........(and I've included volume where I think it's important):
Google (GOOG) which looks like it's pushing through a medium term trendline.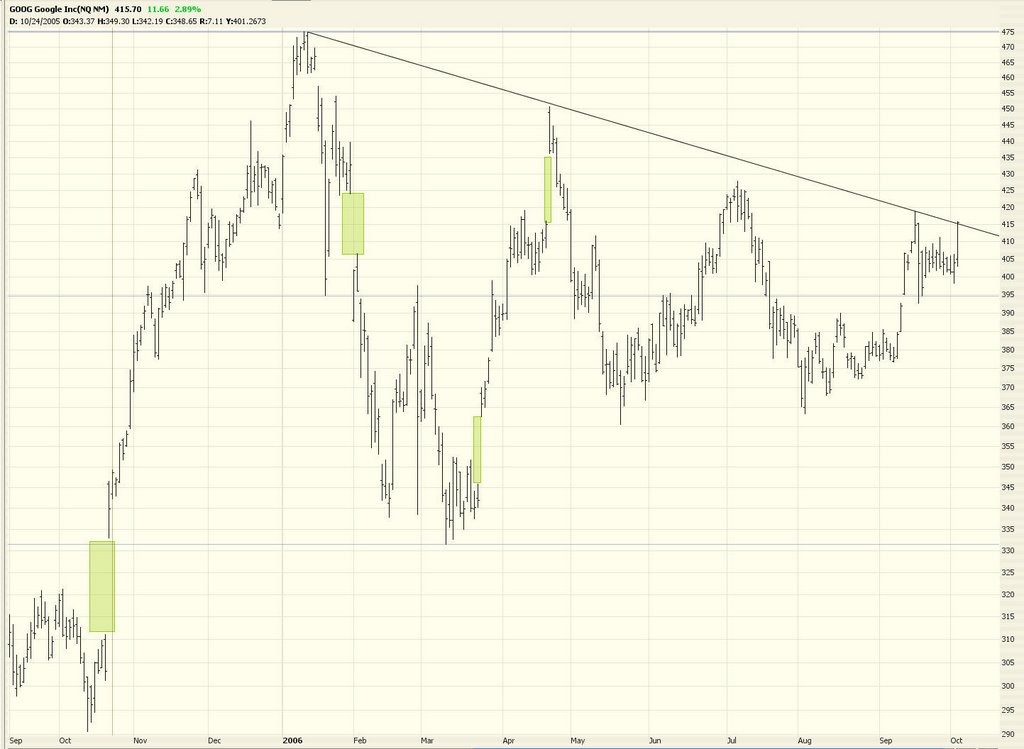
HOV:
HRS:
JEC: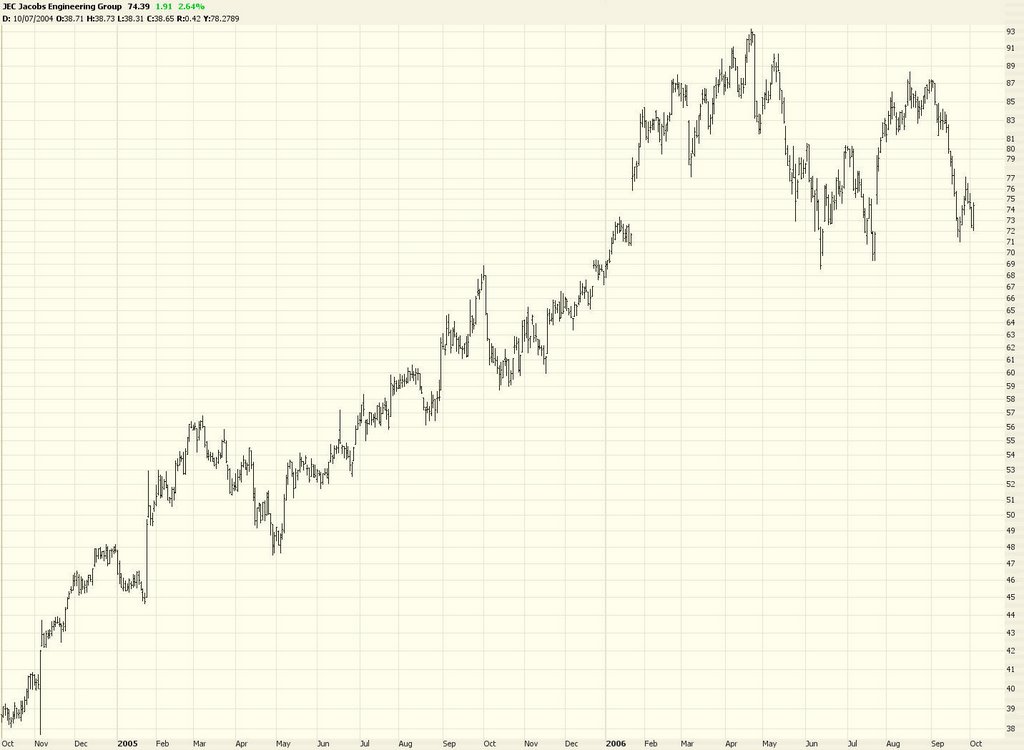
MEE, which was a great short for a while and now seems to be firming up:
MLM:
NEM which is a good play on a bounce in gold:
NOV: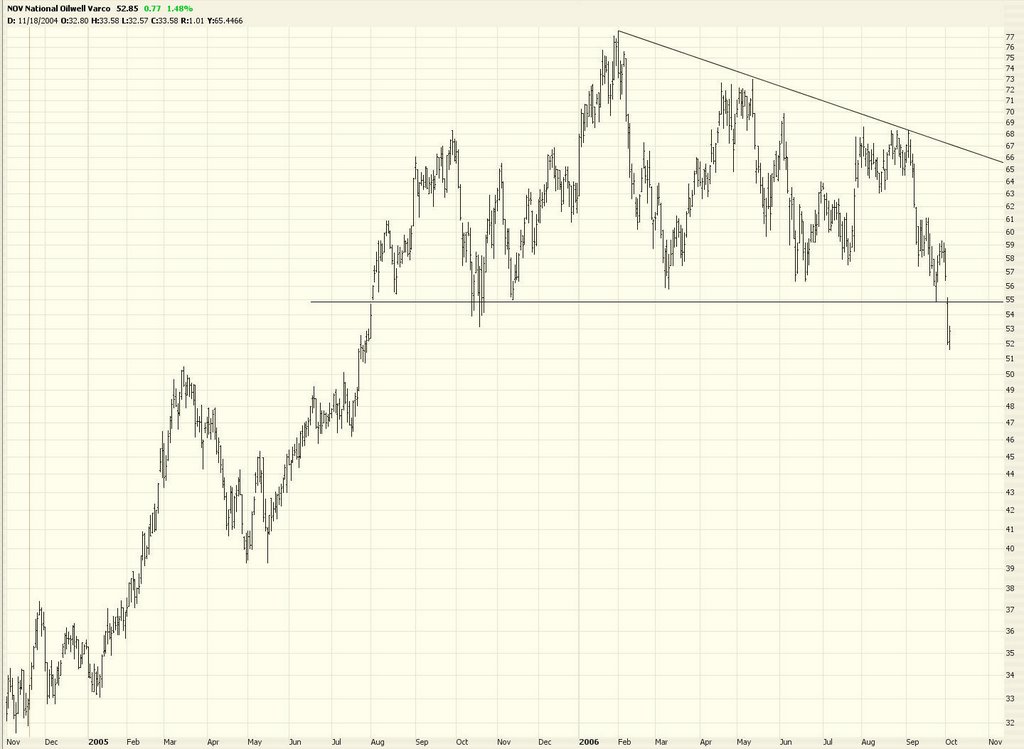
OII: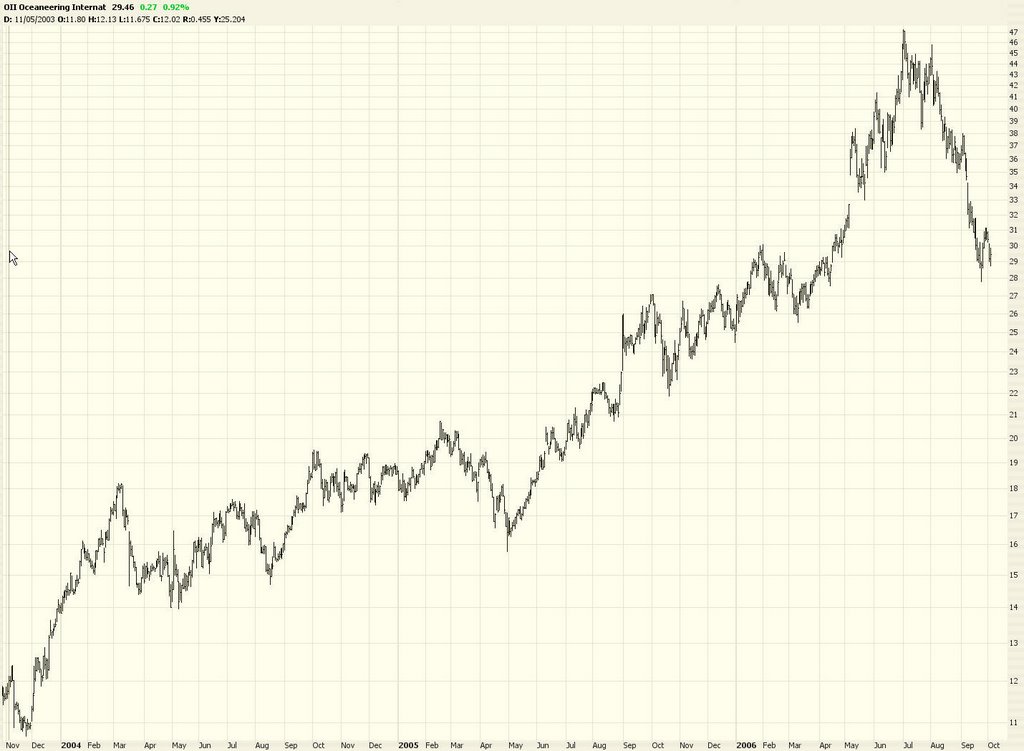
PBR: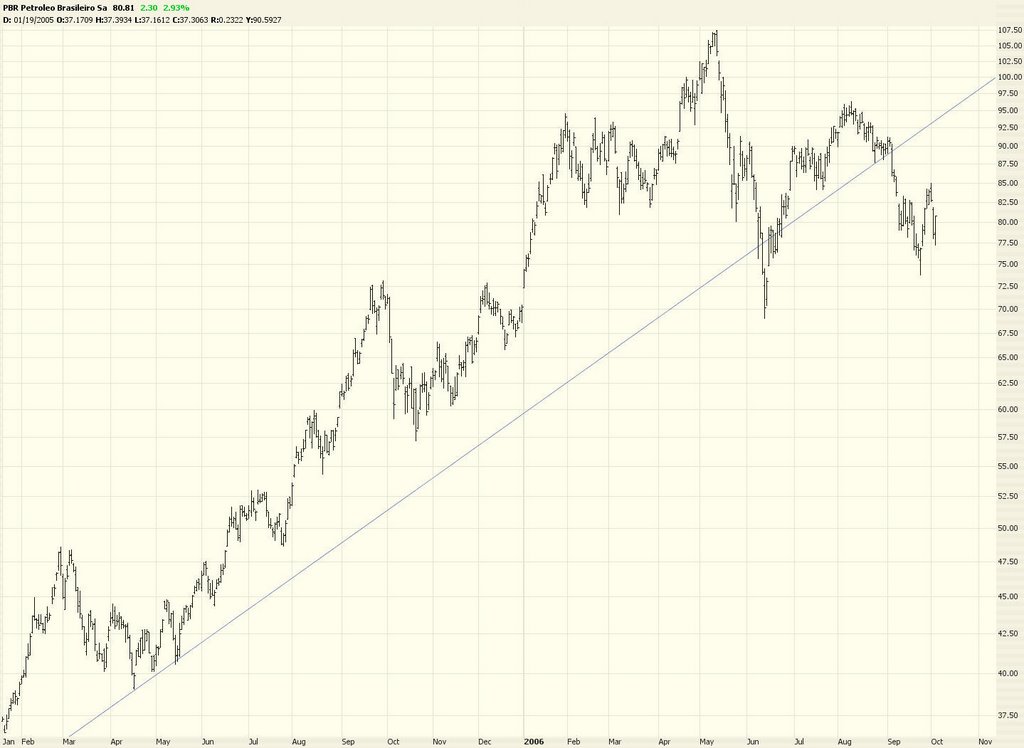
PXD:
RBAK, which is looking really fantastic, particularly when you check out the volume: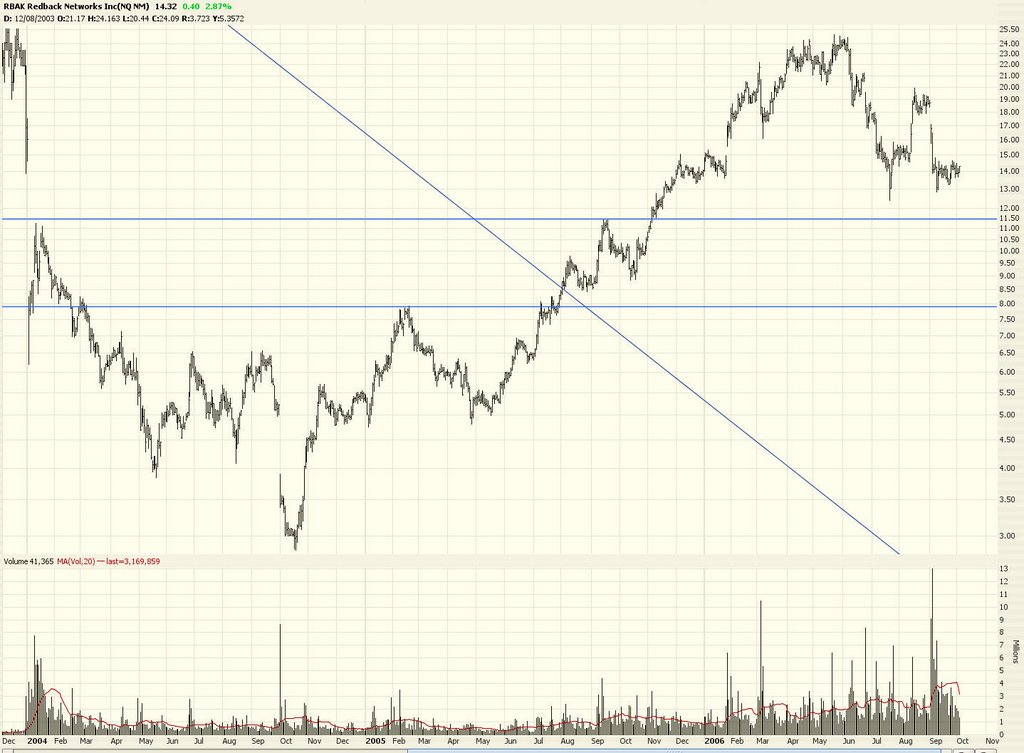
RYL: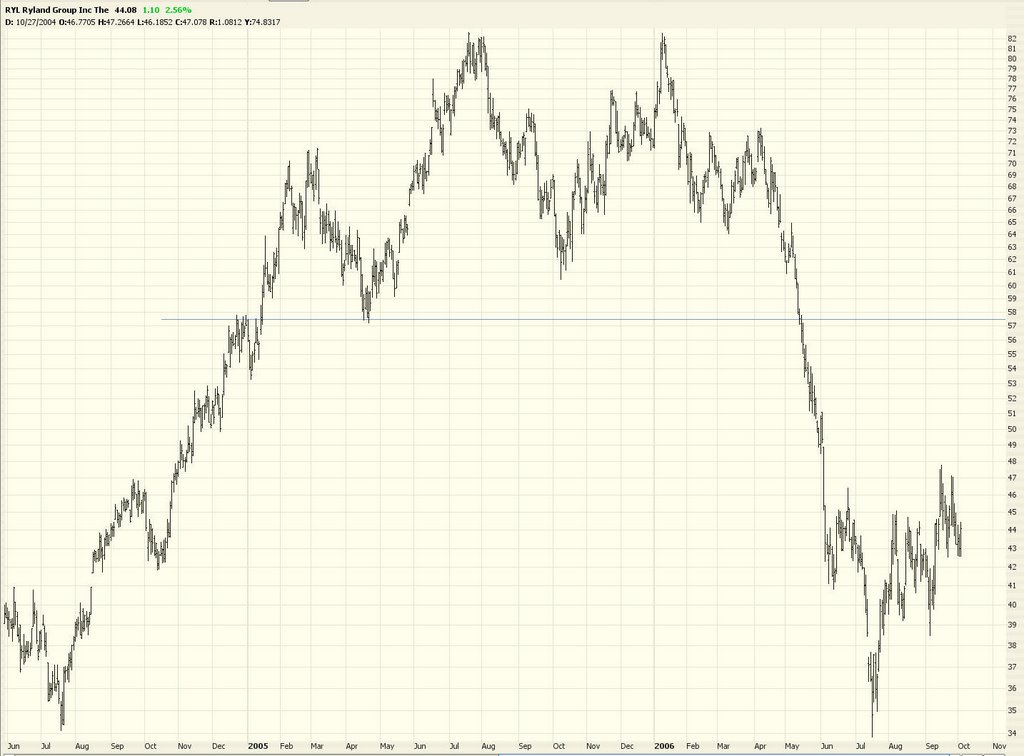
SII: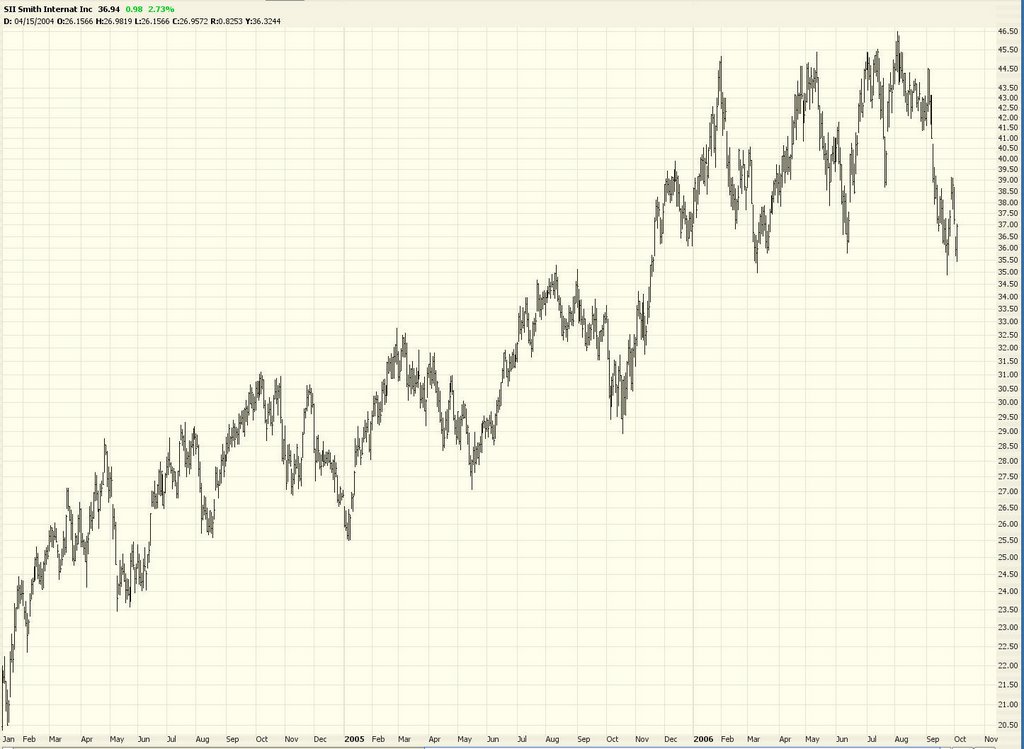
X, which is nearing a supporting trendline: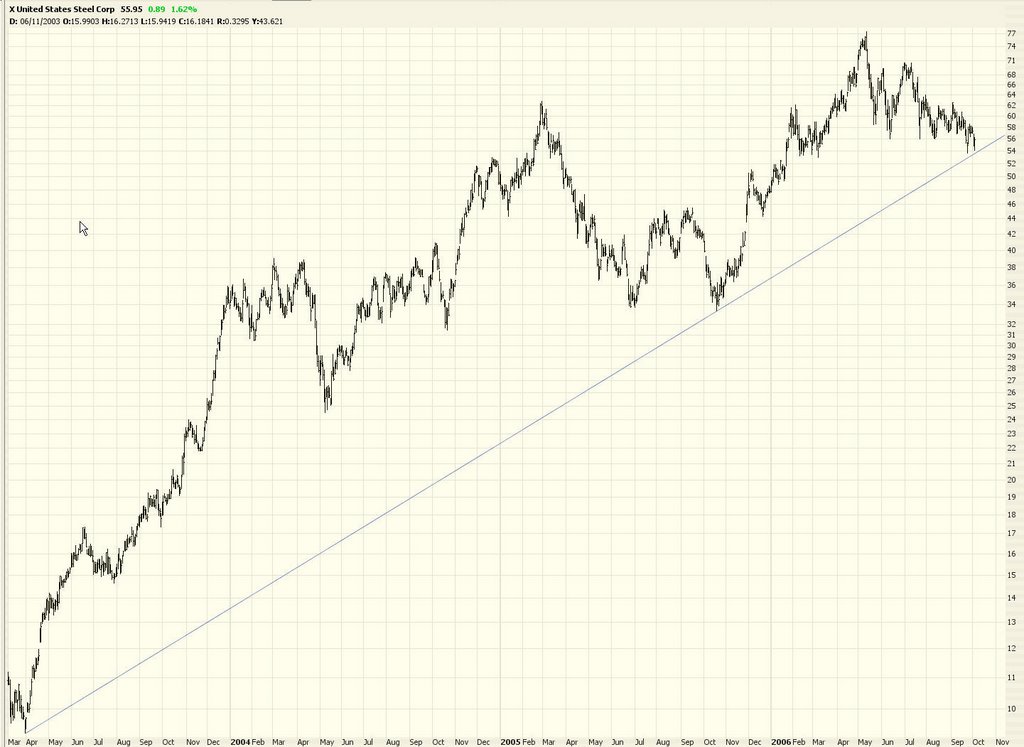
And, finally, the $XAU (gold/silver index) which, yes, looks like a massive head and shoulders pattern, but in my opinion is really at a major support line right now and is quite oversold.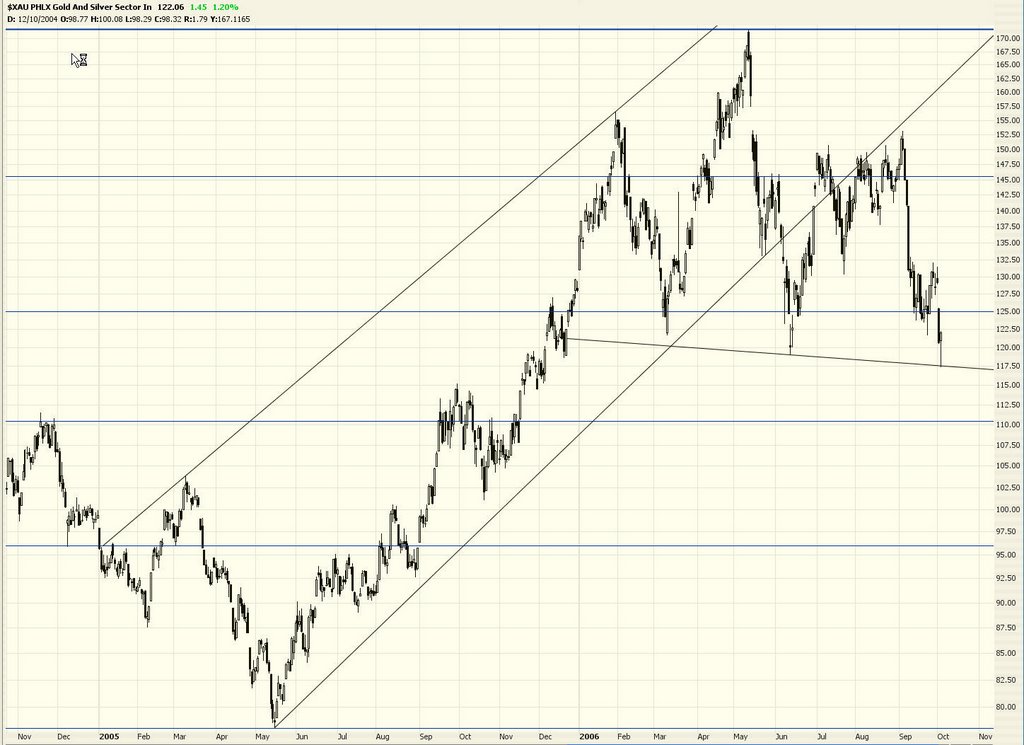
Before anyone starts running around saying the top is here because Trader Tim the Permabear is buying stuff, let me be clear - I've still got plenty of shorts. I still think the market is ultimately in for a big wipe-out. But there are plenty of stocks right now, especially related to energy and metals, that look really sweet on the upside.
Now - - - back to eating my humble pie.
22 comments:
I will post the first comment by saying I've turned off the ability for anonymous people to post.
I can take all the insults, put-downs, and flames you can dish out. But you're going to have to show yourself and let people know who you are.
Tim, sounds like a good idea.
I think the taunting is just reaching epic levels because of where the market is.
"Thank you Uncle Ben for an early Christmas present"
I see a lot of cheerleading, bragging, and taunting by the bulls . .
Well, if tomorrows action confirms today's action, I'm going to buy more calls on the QQQQ
The volume is crazy like a bunch of women at a shoe sale. Not to mention the bounce off 40, and the break off 41 minor resistance. The 40 is, by far the big support level, and it bounced off that. Morningstar, Bullish Engulfing, its all there.
I would love to participate in calls, but to be honest, I'm finding far more bearish charts than bullish. The bullish stuff is still looking rather extended, and I find myself stretching to interpret a chart bullishly.
I think I'm going to need to sit on the sidelines and think about it for awhile.
I see the trend, but I can't find trustworthy charts on the up side.
RBAK looks like an Island in the Sky. XAU still looks like an H&S. NOV looks like it's broken below a descending triangle.
I like RYL, as it may have formed an imperfect inverted H&S, but really, that's the olny one I like upwards... Am I nuts?
I have no desire to fight the trend, but I'm just not buying this. I am not a permabear, but if the charts aren't there, I'm not buying.
Tim, We have a bearish cluster on the other site, How much weight would you put to that?
Hello sir,
I cannot help but think that the next few days, perhaps even tomorrow things are going to turn. The market forcasts are high in the upper reversal zone and there are plenty of reasons for the markets to change, it just not listening yet.
Tim thank you for sharing your insights. I am glad you limited the comments. I do not remember you ever saying you were always right. I am glad you have a passion for what you see in this market. Thanks for sharing,
Kevin in SAC
TIM! You put my X as your call selection.
Very interesting chart on that as well. THIS is where Tech Analysis becomes a little fuzzy. you zoom out the chart to 4 yrs, and you get the chart you have on your site, which shows support level around where its at. However, you zoom out 3 years, and you can draw a similar chart, with much more room to fall.
One year chart (more specifically, the last few months (since May) , and you see it broke a triangle formation.
And this causes a mighty big headache.
But then you look at other stocks in the same industry (like NUE), and you see that NUE has MUCH more room to fall (and that is much more clear cut).
I don't know about the other stocks in teh industry, but with X being intrepretive, and NUE having room to fall - I give the benefit of the doubt to the bear.
Tim, thanks for the blog and your TA. You Rock!
-JayMac
Smallswinger, Are you still short?My $rut puts are painful,whats a girl ta do?
Toshi-Tim...your move on the anon-poster curtailment was sooooo good. Thanks for sharing the bullish charts. The market is still a head scratchter. Bill Cara says to watch for the 17/18th. Very interesting times.
Tim,
I love the bar room brawl reference. Indeed! Great entertainment in here. Better than Springer!
I'm curious about your stops. Do you use contingent orders on the stock price? Or do you put a stop on the option itself? I think I recall you writing once that you generally go OTM one or two months out.
On another, more intrusive note ;), I wonder if you'd share what you generally average as a yearly return. I know that's private stuff, so no worries if you don't care to tell.
Thanks for all your great work.
The new charts are awesome!
Matt
I use contingent orders only. A stop order based on the option price itself would be a real mistake.
I know by now everyone is tired of my statements that the spread still favors stocks over bonds, so I try from another angle.
I have been in this business for almost 40 years...longer than most of you have been alive. This is the first bull market I can remember that even though prices have risen, P/E's have gone down. I also am pretty sure that dividen yields have gone up.
Currently the incentive or "yield pick up" of stocks over bonds is greter than at any time in the past 15 years. Just for the spread to get back to what it was in July calls for the SPX to get to 1500-1600.
I just wish I had not purchased those protective puts....
John
KUDOS TO TIM FOR BLOCKING ANONYMOUS POSTERS!
I took yesterday (Wednesday) off to do some cement work ….. BIG MISTAKE! Huge short covering rallies all over the place!
My Small Cap Swing indicator whipped back to SHORT on Sep 28th. This SHORT signal is at -49 as of Wednesday’s closing prices, barely hanging on. An up day today (Thursday) will whipsaw it back to LONG, even at overbought territory.
Here are the recent values of my Small Cap Swing Indicator for the last four or five switches.
. . . . . .Small
. . . . . . Cap . . . . . . . . .Russell
. . . . . .Swing . . . . . . . . .2000 . . . Cumulative
Date . . . Ind . .Signal . . % Chg . . . . % Chg
08/28 . . +05 . .LONG . . +1.1% . . . . +1.1%
08/29 . . +23 . .LONG . . +1.2% . . . . +2.3%
08/30 . . +39 . .LONG . . +0.8% . . . . +3.1%
08/31 . . +48 . .LONG . . +0.0% . . . . +3.1%
09/01 . . +52 . .LONG . . +0.1% . . . . +3.2%
09/05 . . +62 . .LONG . . +0.8% . . . . +4.0%
09/06 . . -19 . .SHORT. ..-2.1%. . . . . -2.1%
09/07 . . -43 . .SHORT. ..-0.8%. . . . . -2.9%
09/08 . . -61 . .SHORT. ..+0.3% . . . . -2.6%
09/11 . . -72 . .SHORT. ..-0.1%. . . . . -2.7%
09/12 . . +18 . .LONG . . +2.4% . . . . +2.4%(short-covering)
09/13 . . +41 . .LONG . . +0.8% . . . . +3.2%
09/14 . . +54 . .LONG . ..-0.4%. . . . . +2.8%
09/15 . . +65 . .LONG . . +0.2% . . . . +3.2%
09/18 . . +70 . .LONG . . +0.0% . . . . +3.2% (short triggered)
09/19 . . -06 . .SHORT. ..-0.5% . . . . -0.5% (& confirmed)
09/20 . . -05 . .SHORT. ..+1.2% . . . .+0.7%
09/21 . . -13 . .SHORT. . .-1.0% . . . ..-0.3%
09/22 . . -37 . .SHORT. . .-1.2% . . . ..-1.5%
09/25 . . -43 . .SHORT. . .+1.2% . . . ..-0.3%
09/26 . . -39 . .SHORT. . .+0.4% . . . ..+0.1% (long triggered)
09/27 . . +17 . .LONG . . . +0.4% . . . . +0.4% (& confirmed)
09/28 . . -19 . .SHORT. . .-0.4% . . . . -0.4% (whipsaw short)
09/29 . . -25 . .SHORT. . .-0.6% . . . . -1.0%
10/02 . . -48 . .SHORT. . .-1.5% . . . . -2.1%
10/03 . . -64 . .SHORT. . .-0.1% . . . . -2.2%
10/04 . . -49 . .SHORT. . .+2.1% . . . . -0.1%(short-covering)
Normal LONG target: . . +65 to +75 (max: +95)
Normal SHORT target: . -65 to -75 (max: -107)
I remain 100% invested in SHORT positions as of Friday’s close, 9/15/2006 (RUT=729.35 to 733.47, a +0.5% advance). Haven’t lost much since going fully SHORT, but it hurts to have the trade gains vaporize.
These 1-3 day price reversals are not being detected well by almost all my technical indicators. Even the old standard candlestick patterns are being whipsawed.
Chart patterns are not reliable right now. Upward bearish wedge patterns are getting extended beyond norms without expected corrections. Stochastics and RSI values have become almost meaningless as they reverse direction in mid-stream, seldom getting to meaningful range bottoms.
Advances are narrow, with large caps setting records, while Dow Transports, mid caps, and small caps languish in a sideways chop pattern.
Has anyone ever seen a September-October advance of this magnitude? Without a meaningful correction there is little hope that the traditional November-April period will be healthy.
This appears to be a highly manipulated market with bearish divergences on almost any chart I look at. Somebody wants the GOP to look good going into the November elections.
The administration is likely biding time before mounting any serious military action against states like North Korea, Iran, Syria, etc. After the elections I expect unusual geopolitical activity. At that point, the lame duck Bush has little to lose and a legacy to create. Market corrections could find a meaningful foothold later this quarter if this is the “Master” plan.
(hands in the air)
Guys I have converted my shorts (puts) on NUE and X into bullish ones - broke out of the triangle with conviction.
It looks like while the markets may tank, these stocks are poised for the higher ground.
denver_investor, JOYG looks like a fantastic buying opportunity...
good call. (literally!)
Tim,
I had suggested adding horizontal lines to the new Market Forecast Chart indicator @ the 80 and 20 reversal zone areas (similar to the 75 and 25 lines on MACD and Stochastics). I never got a response. Any chance this is going to happen?
Since the forums for the beta site have been removed, who do I email?
Also, when will we see real time data? The new site is great, but I can't use it until this feature is turned on.
Your response is greatly appreciated.
APPL is kinda weak today, but every effords put in to make this an orderly exit.
Bush and his government are corrupt and I would not for a minute put it past them to manipulate the markets to win an election.....you are witnessing it I believe. Err Iraq, Katrina.... where is bin laden?
Divergences everywhere, the oscillator doesn't even make sense anymore....the market leaders GOOG and AAPL are busy been red today.... while the market takes off. GARBAGE.
Well enough politics for little ole me..... DON'T VOTE FOR THEM PLEASE......
Well well well, I see capitulation everywhere on the boards. No more sell, panic, crash signals. We've gotten many sell signals from the "experts" and the market's just kept grinding up.
The oex & qqq $ weighted put/call ratios are finally low and favoring the calls. We shall see if this holds. Everytime time the ratio was high the past couple of weeks the bears got sucker punched.
Denver:
The difference in May 10th was by then Nasdogs has already put in 3 lower lows and put in 2 big red sticks regardless Dow's continuous marching higher. But this time it is different.
Don't know where this is going but the rush to new highs right B4 earnings is rather suspicious. If I have long positon, I'd rather see it correct down till earnings....
Can't wait for tonight for mu....
Cyl, you can write to brett.sher@investools.com with bug reports; thanks.
Post a Comment