
Cool Water
Greetings, beloved bears.
Although today seemed like a total yawner (Dow down just a few points), it was actually a great day for my portfolios. Oil's weakness (and I am using OIH as my basis, even though obviously that's not crude oil) has been great, and it just keeps getting better. I'm maintaining something like 80 different positions, all puts, and they're doing dandy.
The volatility index, $VIX, is low, low down, and I like that. Because I think it's about to churn upward again. Check out the supporting trendline.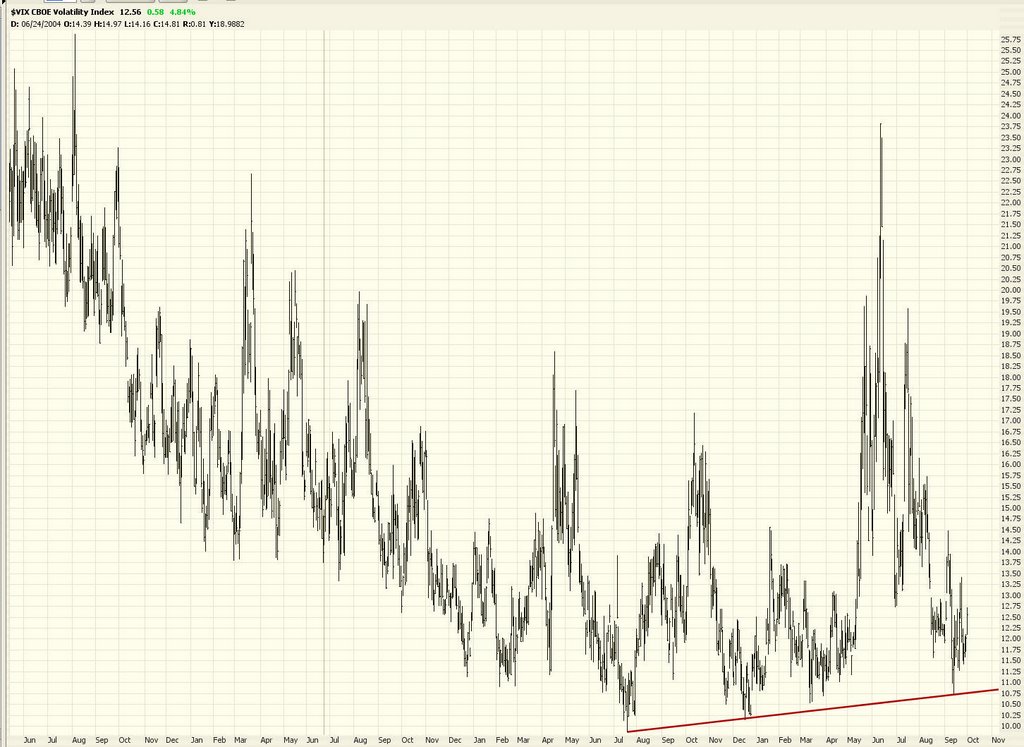
I mentioned the picture-perfect Fibs on the QQQQs last week, and these are behaving very nicely. The $NDX was much weaker today than the other averages.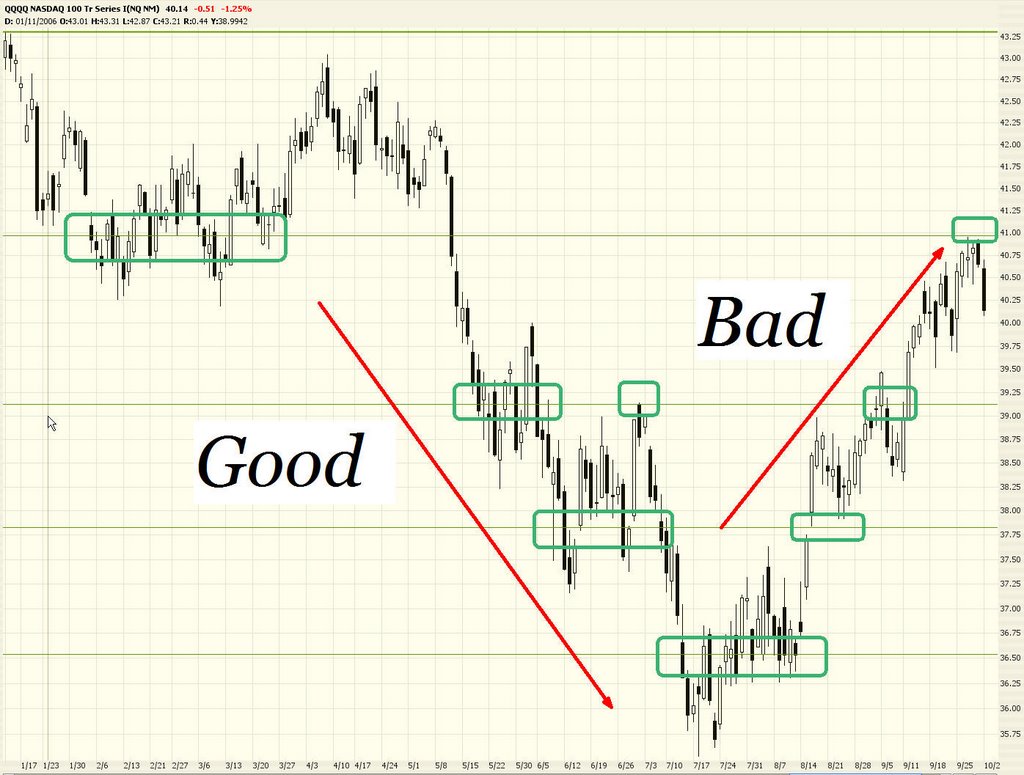
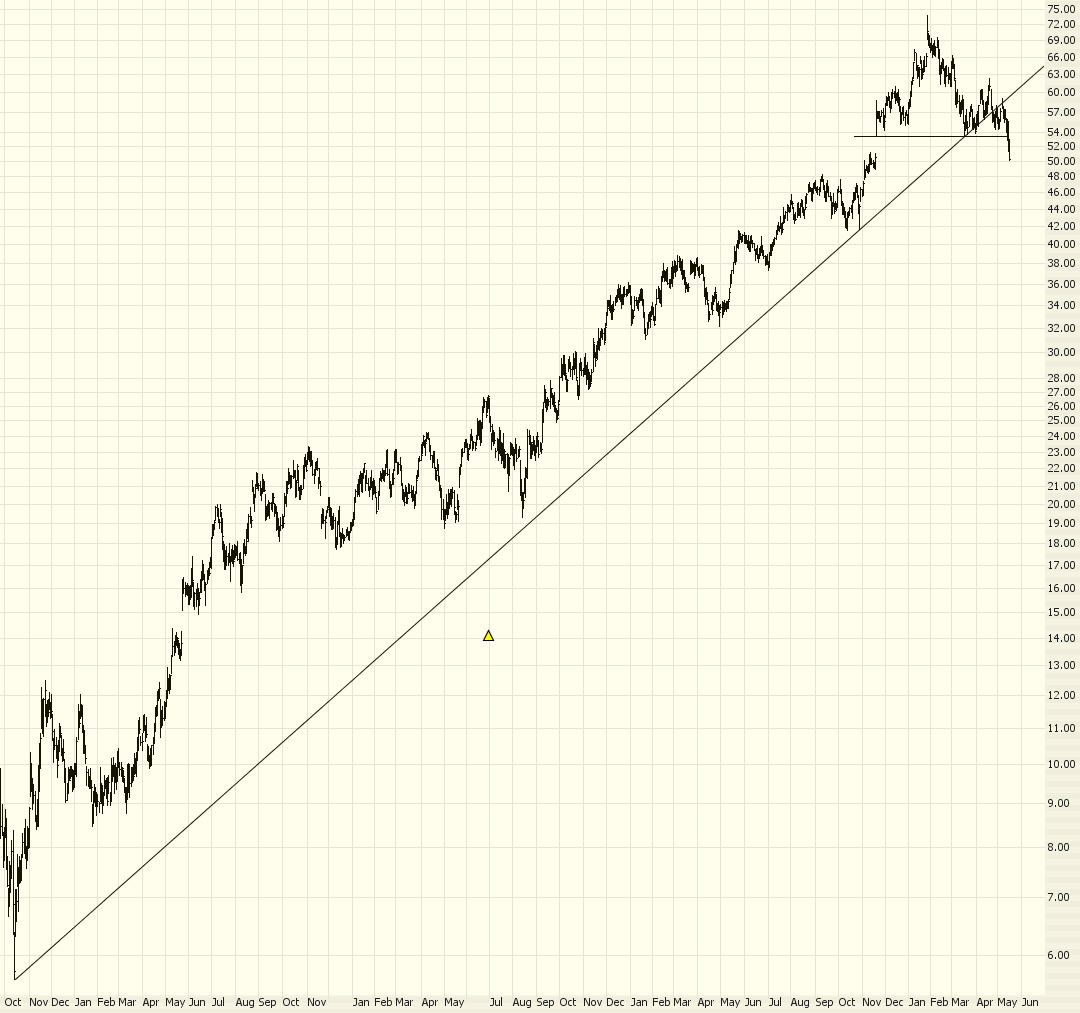
Speaking of OIH, here's an update. I know I post this graph virtually every day, but it's such a honey, it's worthy of our constant care and attention.
The question, of course, is how far down will crude go? I'm thinking about $53 or so in the near term, based on this continuous contract graph.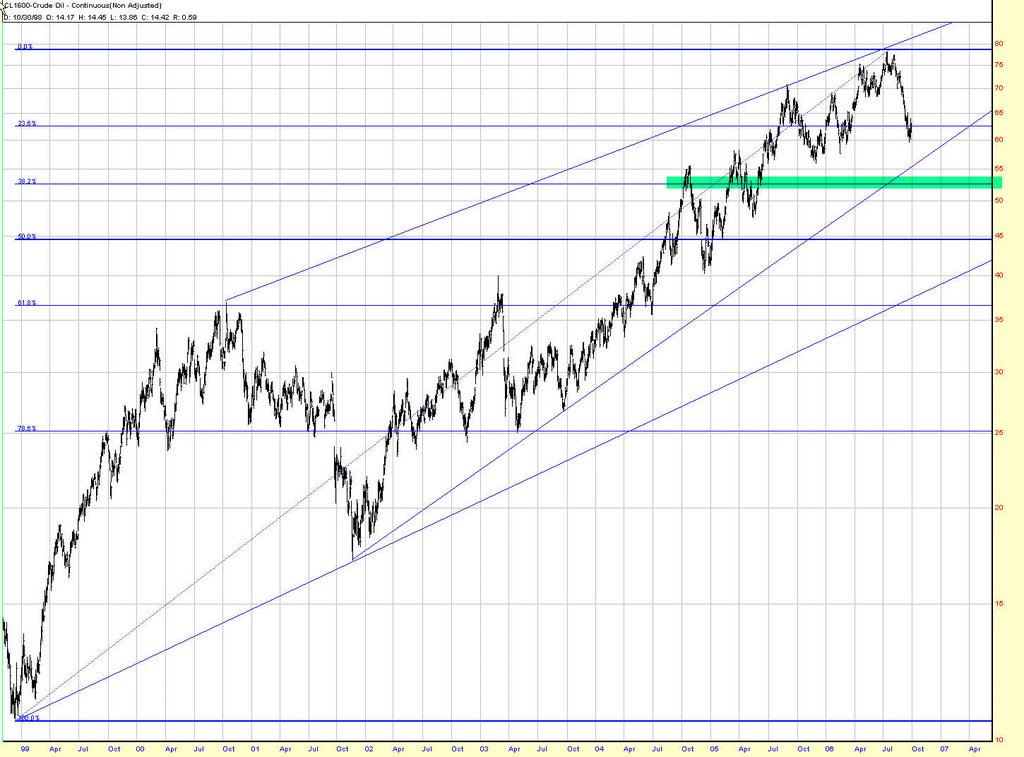
Posting a bazillion graphs is a drag. Let me share some of my newer ideas for sweet-looking put positions. Oh, and hey Prophet.net users - - good news - - I nagged enough to get an OK on making ProphetCharts available on the site. It's gonna cost ya. But these are God's own charts.
I like CME. It's expensive, which means there could be real some green on options movement here.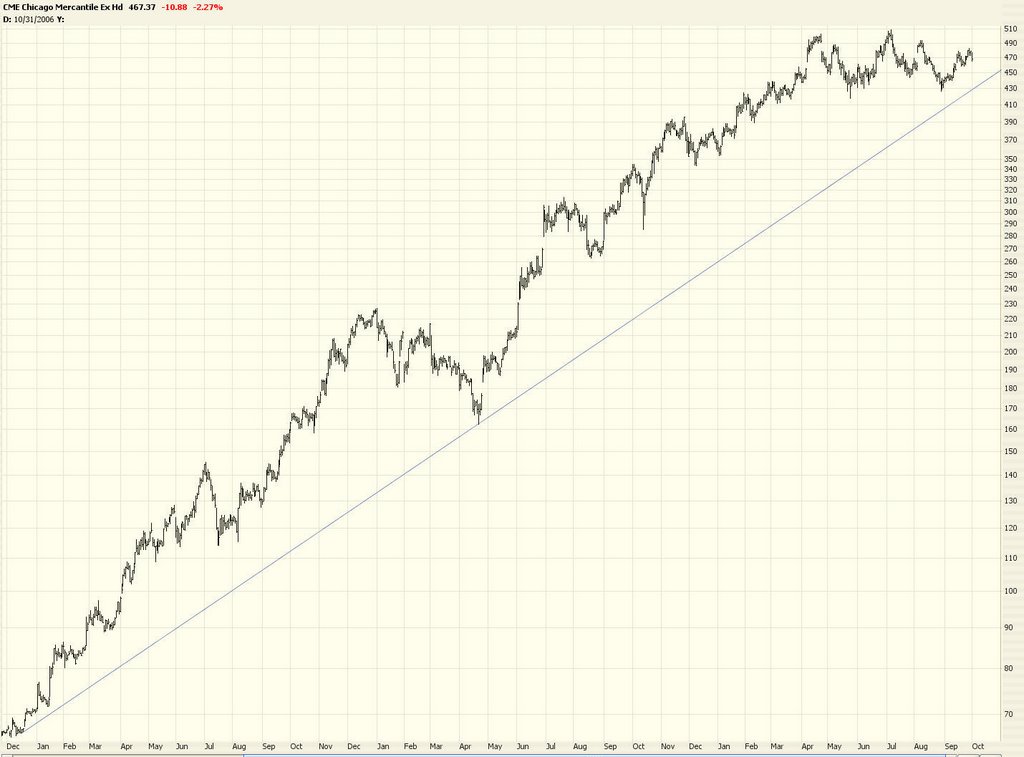
Oh, and if you go back to my entry of May 16, I suggested MRVL as a short. If you look at the graph from back then, you'll see it was about $54 at the time. In after-hours trading, it's something like $16 right now. Yowzah! Nice.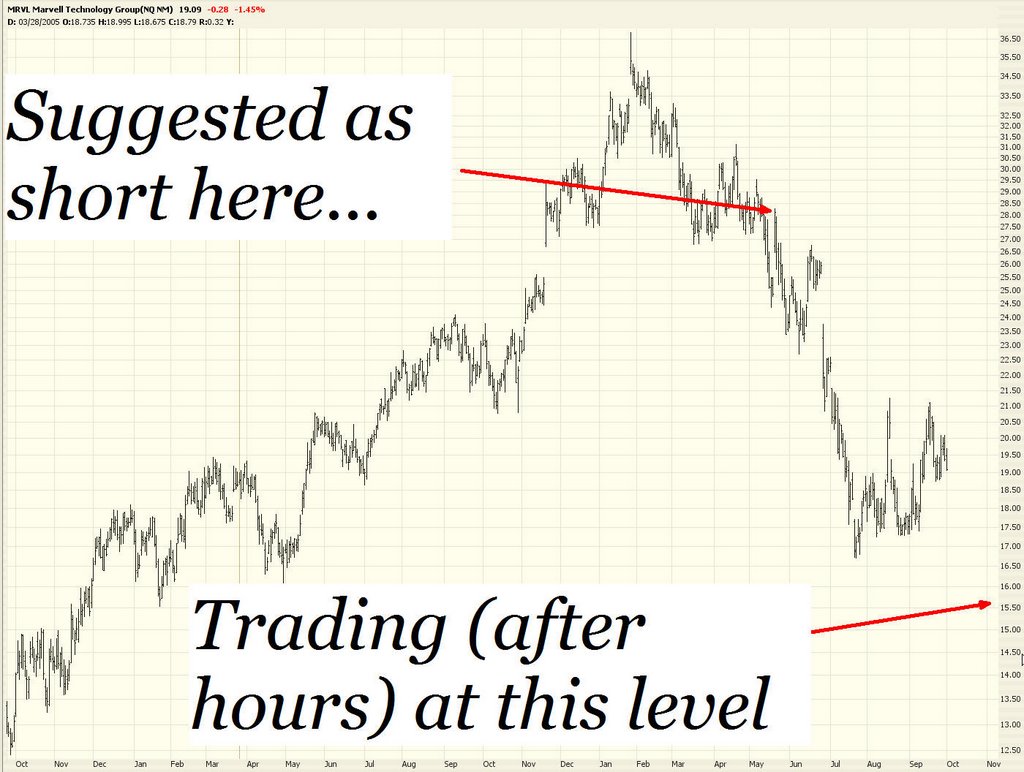
For the convenience of any visiting bulls, here are direct links to Garfield, Cathy, and Family Circus. I hope they tickle your long-horned funny bone.
63 comments:
how far do you think MRVL will go? Do you think its good to short now? :)
-Your Regular!!
MRVL sitting at a 52 week low right now, it showed alot of strength these past few weeks, now back to new lows. Think it may move down to the 12-14 range over the next 2 months, but I think there are other places to go short. Tomorrow will be interesting, if there is a follow through and the markets drop hard tomorrow I think volatility can be back by the end of this week.
Watch the semis, last time the markets were in rally mode in the beginning of 2006 SMH topped out at $40.64 now trading at 33.50 AH. The semis havent really participated in this rally and I do think they fall hard once the markets start to sell off, would be a buyer of SMH around 28-30 a share.
Trader 2006.
by the way NDX 100 to 1600 by 3rd week of OCTOBER!!!
Any QID buyers here. 1600 would put QID at around 64.5-65 a share.
Trader 2006.
Personally, I wouldn't go near Marvel. I was just patting myself on the back.
What about RIMM? Doesn't it look expensive.. also AAPL?
Did MRVL split? - in the older chart it was around $54 in May, in the newer one it shows around $28.
MRVL split 2 for 1 on July 25th, yes.
In retrospect, it was hardly necessary!
The symbol I used for crude oil was CL1600.
nice chart on Crude.
I've been saying that Crude goes back to it pre-9/11 price of $27.63. That's almost where you drew your line, right?
Thanks, Tim. (great call on mrvl, & prbl'y a great call on a big down move coming in CME.)
not to be a party pooper, but all recent early in the week reversal days were followed by moves higher. For almost a week now the bulls have been on the verge of setting a new closing high. I think they'll get it and scratch up to 'bout 11,900ish on the DOW before the plunge begins. We might even see that rarified air of 12K on the futures soon ... have some cash ready to sell this bitch!
-Trader Fred
the fed could be out of money for now.... the DIA could correct back to the 20EMA... shorts on today
QQQQ, IWM, SPY, DIA
GL
Good call on the q's. Looking at my re-entry into the ndx and qid. Catch ya on the down side.
Keep posting those great links to those humorous comics. I surely did not like that darker stuff (heh, heh).
Nice call on CME...from a fundamental point, VERY overvalued. Stock at 465, value compared to peers 200...time for some puts.
John
market volatility is slowly coming back into the market..
trader 2006.
went for a trade in PXJ at around 17.35. Only for a swingtrade. I have done very trading PXJ at these levels in the past. Think it heads back to 17.75-18 by next week. good for a 2-3% gain.
PXJ tracks OIH very closely...
PXJ is a powershare and OIH is a holdr.
Trader 2006.
Hey Tim, you forgot to link Foxworthy. "You know you might be a redneck when you type in bare market into a search engine looking for porno pictures and you end up on Tim's Blog".
Sorry I'm from the midwest...
cowboytrader i expect volatility back in by the end of this week, should be seeing some big swings in the market very soon
trader 2006.
The pattern the last 2 months has been, 2 days selloff and a rally to new highs on rising volume (clasic bull market action). Today is the second day of selloff. Lets see if the pattern continues. The top of the break out at 1327 held at the S&P 500. This market does not want to crack.
If I don's see anything extraordinary to the downside, like a 1% or 2% sell off on 2 billion shares volume I have to assume that it is going higher'
costas1966
They are just want to buy this market. there is money supporting this market. I see rotation going on instead of a wide sell off.
costas1966
look to buy qid around 60.50-61.25
MZZ 69.25-69.75
Trader 2006.
The pattern remains intact, 2 days sell off and rally to new highs. I bought some divx today I got to go with the madness.
Costas 1966
The buying seems very concentrated in the DJIA type stocks. Since the headline index that gets quoted to Joe 6-pack each night on the news is the Dow Industrials, it *is* the market to the average person. We haven't had a 1% down day on the Dow since July 13.
Have 'they' decided by supporting a few big cap stocks, they can make it seem like the market (hence the economy) has never been better? There's an election coming up ya know...
Until the DJIA finally cracks at least a bit, with at least a close at 11600 or lower, or a 1%+ down day, the game will continue.
I'm starting to see more breakdowns in the market as a whole though...and the semis don't look all that strong to me..look at Sandisk SNDK. I read semi inventories are climbing..not a good omen.
nearly 3 months without a 1% drop. I think were do for one
trader 2006.
My Small Cap Swing indicator whipped back to SHORT on Sep 28th. This SHORT signal reached -48 as of Monday’s closing prices. It is at -66 intraday on 10/3 at 12:00 noon ET.
Here are the recent values of my Small Cap Swing Indicator for the last four or five switches.
. . . . . .Small
. . . . . . Cap . . . . . . . . .Russell
. . . . . .Swing . . . . . . . . .2000 . . . Cumulative
Date . . . Ind . .Signal . . % Chg . . . . % Chg
08/28 . . +05 . .LONG . . +1.1% . . . . +1.1%
08/29 . . +23 . .LONG . . +1.2% . . . . +2.3%
08/30 . . +39 . .LONG . . +0.8% . . . . +3.1%
08/31 . . +48 . .LONG . . +0.0% . . . . +3.1%
09/01 . . +52 . .LONG . . +0.1% . . . . +3.2%
09/05 . . +62 . .LONG . . +0.8% . . . . +4.0%
09/06 . . -19 . .SHORT. ..-2.1%. . . . . -2.1%
09/07 . . -43 . .SHORT. ..-0.8%. . . . . -2.9%
09/08 . . -61 . .SHORT. ..+0.3% . . . . -2.6%
09/11 . . -72 . .SHORT. ..-0.1%. . . . . -2.7%
09/12 . . +18 . .LONG . . +2.4% . . . . +2.4%
09/13 . . +41 . .LONG . . +0.8% . . . . +3.2%
09/14 . . +54 . .LONG . ..-0.4%. . . . . +2.8%
09/15 . . +65 . .LONG . . +0.2% . . . . +3.2%
09/18 . . +70 . .LONG . . +0.0% . . . . +3.2% (short triggered)
09/19 . . -06 . .SHORT. ..-0.5% . . . . -0.5% (& confirmed)
09/20 . . -05 . .SHORT. ..+1.2% . . . .+0.7%
09/21 . . -13 . .SHORT. . .-1.0% . . . ..-0.3%
09/22 . . -37 . .SHORT. . .-1.2% . . . ..-1.5%
09/25 . . -43 . .SHORT. . .+1.2% . . . ..-0.3%
09/26 . . -39 . .SHORT. . .+0.4% . . . ..+0.1% (long triggered)
09/27 . . +17 . .LONG . . . +0.4% . . . . +0.4% (& confirmed)
09/28 . . -19 . .SHORT. . .-0.0% . . . . -0.0% (whipsaw short)
09/29 . . -25 . .SHORT. . .-1.0% . . . . -1.0%
10/02 . . -48 . .SHORT. . .-0.9% . . . . -1.9%
10/03 . . -66 . .SHORT. . .-0.1% . Intraday @ 12:00noon ET
Normal LONG target: . . +65 to +75 (max: +95)
Normal SHORT target: . -65 to -75 (max: -107)
I remain 100% invested in SHORT positions as of Friday’s close, 9/15/2006.
It looks like this SHORT signal may go much further than the normal target (-65 to -75), possibly near the max of -107.
If you are not SHORT then I would look to SHORT any bounce.
If you look at the small and mid cap indexes you will see a distinct upward bearish wedge from the July period to now. You will also see that the indexes are breaking out and down from these bearish wedge patterns. The normal path for breakdowns from bearish wedge patterns is to the base of the upward triangle, i.e., July prices. There will be short rallies, but a correction to July prices would be a normal action for bearish wedge breakdowns.
going long QID very soon, missed out on QLD, was going to buy around 75 but everything just looked so weak. Then everything just went crazy and jumped. Today may be the day they close it above fresh new highs. If they cant i feel sorry for them
11737 is where it sits at the moment.
Trader 2006.
sold my PXJ at 17.50, looking to buy in tomorrow, didnt want to hold ahead of the inventory data. Suppose to get cold in the northeast the end of this week think this may be the excuse they use to pump oil to 64 a barrel...
Trader 2006.
bought some QID at 61.65
lets hope for a drop by 4pm........
Trader 2006.
I am one speechless bear
F* the market
PB i dont think they are any shorts left. I think this is just money going onto the market. If the M3 figures Tim posted are correct I think that is the answer. There is liquidity building and going into the markets, mainly large caps. Very likely this liquidity is coming from the FED or out of housing real estate and into the stock market. This is definitely not an enviroment where one should insist shorting. You need to mix it up and keep stops at all times.
YES! THE DOW 30 GOT TO A NEW LIFETIME HIGH! YES YES YES! THIS IS GREAT NEWS!
Oh, and OIH is *lovely*.
9:35am agree
Very likely this liquidity is coming from the FED or out of housing real estate and into the stock market.
disagree on the
This is definitely not an enviroment where one should insist shorting. You need to mix it up and keep stops at all times.
trader 2006
if the dow does nottttt close at all time highs today i think this may be the last chance. 11737 right now up 67 points. Would be interesting to see if we close down today.
Trader 2006.
This was to be expected....they won't give up until they get the record.....
Now the question of the day is...WHERE IS THE VOLUME??? This market isn't breaking out until volume gets jiggy.
I'm looking for divergences and stocks ready to tumble....so far BEN and MER come to mind. Top of the range....low vol.
i think they take the market to new intraday highs in about 20 mins
Trader 2006.
"The intra-day high is at 11,903"
I'm afraid I disagree. There is a thing called the THEORETICAL Dow 30 which might have reached that level, but the regular Dow 30's lifetime high has been pierced, as is being reported on every major media news site. Today's the day.
tim knight meant to say intraday highs on the dow today not highs at 11903
John Murphy's comment today notes the lack of breadth in this advance; and also the lack of confirmations by the nasdaq, sox and Russell 2000.
Gold is getting absolutely trashed today. The metal was down $21/oz and the HUI gold bugs index is down almost 6%. I think we're near a significant buying opportunity, but I seem to be wrong about pretty much everything lately; so we'll actually probably drop another $100/oz....lol.
I'm in awe of Hank Paulson. This man knows how to move markets.
This isn't genuine buying people...time to awaken the bear.
This is a short covering rally by those that got short.....
BNI just popped intraday...looking at buying puts near the 200 day MA.
This is pure manipulation...short the heck out of this rally no volume.
UNP BNI just popped....on nothing....
who cares about VOLUME volume is nothing... PRICE is KING. TRADE PRICE. You cant trade volume.
ANOTHE R F'IN PUMPO JOB BY THE FED ... gotta love it. as the world crumbles down around us.
we just had our first minus 1000 TICK since SEPTEMBER SIXTH!
this is an unbelievably long stretch without a minus 1000 tick on the nyse
tick-wise the market seems much jumpier today than I've seen in quite a while...for what it's worth
Spinning head what does a minus 1000 tick mean?
It looks like today the media is going to see their spin come true, as the DOW likely sets an all time high for both intraday and close.
STOCK MARKET AT THE VERY TOP!
As you know, I invest only small caps, using my small cap swing indicator as a guide. The small caps are going nowhere - still down over 8% from their May highs. And doing nothing on this record making day.
This is a very selective advance, mostly in the DOW and a few other large cap stocks -- easier to manipulate!
What happens when you get to the very top of the roller coaster?
(Even you large cap players are in for a good ride ---- down!)
|
|
|
|
V
The pain feels good today! Im getting drilled by the gold plunge
!lots of pain! luv it baby. This will pay off in the long run.gotta believe baby. when this baby blows up , ill be there for the party!
Short SPY, DIA....they are chugging......
Im waiting for the morning to buy puts.....
This is an overdone rally.
Here's a definition of the Tick from traders101.com...lots more there about the TICK:
"Tick indicator
A market indicator based on the number of securities whose last trade was an uptick or a downtick. Used as an indicator of market sentiment or psychology to try to predict the market's trend."
the tick normally oscillates between -1500 and +1500, but readings over 1000 in either direction indicate extreme buying or selling pressure at the moment and are usually short lived; the theoretical max or min tick is limited to the number of issues traded on the exchange, probably around 2000? not sure of the exact number
when a buy program is insituted it is common to see the tick spike upwards to over 1000; we've been seeing this over and over again for the last 6 weeks in particular
the tick is updated every few seconds by the NYSE; symbol is $TICK (at least on eSignal); it is the total stocks whose last trade was on an uptick minus the total whose last trade was on a downtick for the current period
hope that helps...Google 'stock market tick' for more info
The end for the bulls may be near. All bull markets end with the large caps leading the way, while the small caps refuse to participate.
- Keith
Great minds think alike, sanjay ;)
Sorry- that was me, sanjay
-Keith
wow
5 mins left dow at 11722
Short Play Pays Off on NDX
By Chris Schumacher
About this article:
I do not expect this to be a bear market retracement, just a simple pullback. . I won't get aggressive on the long side until a move back to 1585. . I expect the index will climb higher toward the end of the year. .
Bears ready!!!
3 2 1..........................lets take it down
Trader 2006.
cheers
trader 2006
DOW is up like 9.6% YTD --- it's gonna be like 1.2% by the time the BEARZ are done ... see ya' later homos!
- Trader Fred
re:Mkts
I can't get excited about shorting any of the indices when there's no reversal signs. Granted there are divergences but those are warning signs and not a sign to take short positions. But to each, his own.
re: OIH.
Volume 60% higher and price off 4.46%. See if it can break thru 120 and close below that. That would open it to 110 ST. The descending right triangle shows potential low to 90.
re: SLV
Working its way back to 105 area - previous low. 105-100 look possible.
Still feel like the mkts are gonna thread the needle. Something like a short but massive selloff in late Oct/early Nov that would put a tradeable bottom in and then a combination of Fed easing/drop in oil to cause the mkts to take off again. Just pondering the possibilities. Big boys want that Q4 and EOY bonus check.
Do your own homework
bsi87
I see a 3-5% pullback sometime late oct/mid november. Think oil will find a bottom soon, once we get our first cold front in the northeast they will make an excuse to keep oil above 55 a barrel.
Trader 2006.
pb - yes I agree the all time Dow intra day high is stated as 11903. Tim - you disagree and so does the media. I dont understand the difference of facts. This is an important matter as I truely believe no major setback will occur until a clear new all time intraday high has been set. If 11903 was a touch price for even a brief secong, that is where this market needs to go before a plunge - hence the talk of Dow 12000 as being the major benchmark and a turning point down, in the opinion of bears (and proabably most of the bulls as well). Anyway, whatever. Now the real test begins........
re:Mkts
I can't get excited about shorting any of the indices when there's no reversal signs. Granted there are divergences but those are warning signs and not a sign to take short positions. But to each, his own.
bsi87
im with you, i see no signs of the markets tanking in the short term, there will surely be money coming off the table but no big money firms seem eager to sell, and most short hedge funds just got hammered. when the drop comes it will be a slow roll and then a drop on VOLUME, until then, trade the path of least resistance folks,
the real reason markets are not down is because Joe B is still out there jinxing the bears. untill he become wild bullish, there is no chance for the bears and buy da dips will be the name of the game, the minute he is bullish.......game is over
"pb - yes I agree the all time Dow intra day high is stated as 11903. T"
Guys - - - I've been in the financial data business for 16 years. I built and sold a financial data company. I built it from scratch. I know what I'm talking about. Trust me, you are incorrect on the above.
I found 11,750 as the previous Dow intra-day high, which would confirm Tim's comment.
-Keith
Post a Comment