
Crrrrrrrrrrrrrack........
Maybe, just maybe, we're finally getting some direction. I'm starting to like this market again. And there are some really juicy-looking tops that appear to be in the making, including crude oil, copper, and gold. No, you haven't stumbled onto a commodity blog.....it's just that the fall of those market make for some very nice equity collapses as well.
The $INDU clearly broke its short-term trendline today. The next stop, highlighted in light blue, is to fall to that Fibonacci level (which also happens to be the most recent low). If it cuts below this level, that's fantastic, because that will put the "higher highs/higher lows" channel into its grave.
The S&P 500 is still within the confines of an ascending channel, but it's looking weak. The next stop, I'd say, is that highlighted blue area, which will not only mean that the ascending channel has been busted but will also set up a new goal: the next Fibonacci level lower.
Looking at the Gold/Silver index ($XAU), there appears to be a head and shoulders in the making. Now I realize anticipating patterns is a big no-no. (I also realize I don't exactly have the steady hands of a surgeon, hence the not-so-great drawing in red where I'm trying to show the pattern). But I think this is enough of a low-risk/high-reward ratio here to bend that old rule.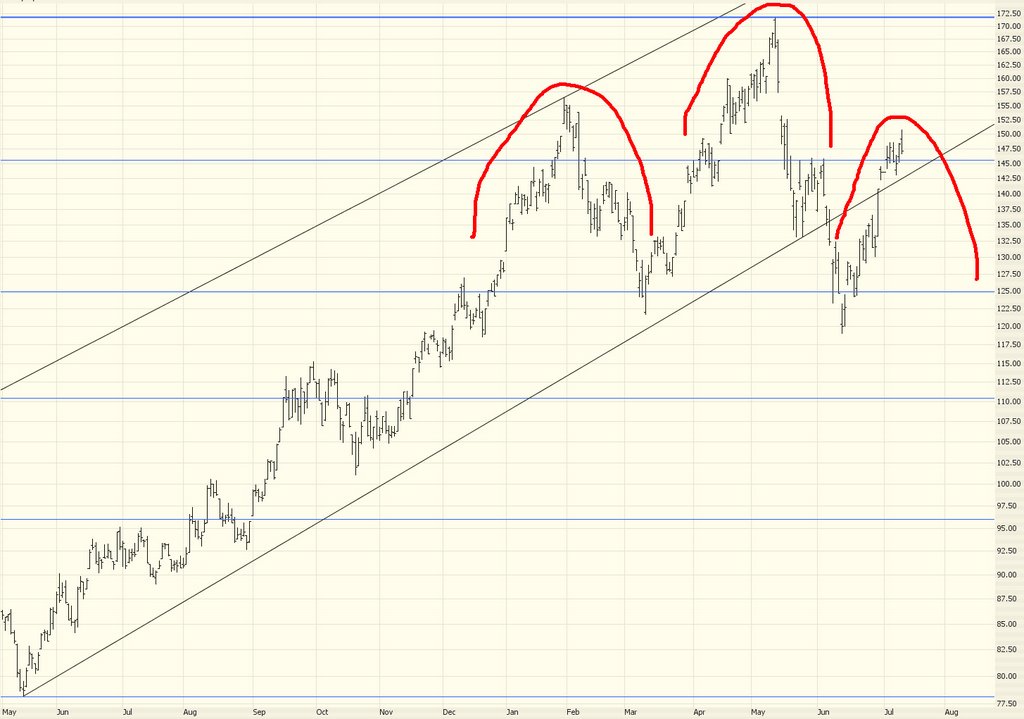
I'd love to show more charts, but it's 2:30 in the morning, people! I gotta get some beauty sleep!
31 comments:
Thank you so much for your effort. I am a regular every day reader and I check your blog three times a day for updtes.
Hope you make lot of money because you deserve it for sharing your knowledge for free. what goes aroud comes around.
Thank you.
PB makes an excellent point. China has been flushing their market with liquidity. There Cb's print harder and faster than we do (and despite what all the gold bugs and permabears say we're actually more conservative than the Europeans). China was going thru deflation until housing lifted them out of it and now housing is settling back down.
Have you guys read some of the news articles about the ECBs preparing for a banking crisis? They're talking about 40% reductions in banking business, dervitives blow-ups etc..etc..
It really does sound like 1929 all over.
Tim,
2 questions:
1) Is the H&S formation valid when the left shoulder is at a higher starting point than the right? Isn't the
right shoulder always supposed to have a higher starting point?
2) How do you pick peak and troughs for Fibby retracements?
3) How far back does prophet go with historical data? And can I also do things like create squares (Gann based
squares), look at RSI and sentiment indicators?
Ok, that was 3 questions.
Today is a great day. Up $4k already!! WOO WOO!
To answer Mike......
(1) The left shoulder should be higher than the right. If the $XAU graph goes as indicated, this would hold true. I think the idea is that the market is more 'tired' by the time the right shoulder is formed, and thus doesn't make it quite as high.
(2) That's a great question; it really varies from chart to chart; buy my book when it comes out in February; maybe by the time I write that chapter I'll have some rules!
(3) Prophet goes to 1959 for futures and 1968 for stocks (although a handful of indices go wayyyyyyyyy back)
And, yes, today is a great day so far - over 100 points blown off the Dow, and we're under 11,000 again.
Hi Tim,
I understand you are busy, but if you have a second can you please tell me why you said "Now I realize anticipating patterns is a big no-no." Anticipating patterns is exactly what I am trying to do (and what I thought you were trying to do) when I do chart analysis. Also, thanks for your site man. I have recommeded many times. Its not only great information but its funny as hell.
Stephen
Hi Stephen,
Thanks for the kind words. By "anticipating patterns" I mean projecting the completion of a pattern that hasn't completed yet. So in this case, you've got a left shoulder, and head, and about half of a right shoulder on $XAU. It's tempting to think "Awww, this thing is gonna break anyway, I'll just short it way up here and have that much more profit!" But, strictly speaking, it's not a pattern yet. It's a partial pattern. and until it breaks beneath the neckline, one is supposed to simply look and not touch. But, as I've confessed, sometimes I ignore this sound advice and just plunge in anyway. Crazy.
- Tim
QLD is a buy verrry soon. Would be buying under $64.00
DOW broke below the 2nd low 3-month Fib (10927) and appears to be bouncing around it.
Third low Fib is 10839. I think if it gets there, it may very well hit 10700-10780. There is some long resistance there and could bounce up and possibly finish the H&S.
Tim,
With the recent up and down excitement of the market, I have been fighting those fear demons over the last couple of days. Instead of freaking out when my puts took in the A*#@ the other day, I applied your lesson learn from your ‘Don’t Make This Mistake’ post on 6/13. Tightened Stops, have stayed in my trades and are up 27% for the week so far.
Thanks for the great blog… Contributors, you guys are pretty great as well. Love the work.
Cheers and Thanks – David
PS – I am amped up for the soon to be released Prophet Charts. Q. Will it be a seamless transition or will we have to repopulate it with our current watch lists and chart trend line graphics?
NYSE ARMS Index hit 2.05 earlier today. Can this market get any more oversold?
SOX leading us higher again today. Looks like a nasty bear trap is being sprung.
just went long PSQ at $72.52. Think we go back down to 2060. Hedging against my QLD long.
dash how do I get the info for NYSE ARMS INDEX...
Hey Tim:
Great work on the blog...I must admit I am anxious to see your daily posts regarding the technical analysis of the markets.
By the way, i am testing the Beta of the Prophet.net charts...AWESOME! But, I do remember in Vegas you mentioned you could search by technical patterns (Ascending Triangles, H&S patterns, etc.), is that search available on the Beta?
So far, the Beta hasn't had a bug on it...but I'll report it if it does.
NYSE ARMS:
http://www.watchpages.com/trinwatch.html
Everyone please note that this decline in the global markets is VERY likely mainly due to the BoJ draining the last 10 trillion Yen out of the system.
If the pattern follows their previous liquidity-draining practice, then this bloodbath should be over with in about 3-4 trading days.
I'm just guessing, but from the sheer volume, timing (BoJ meets today and tomorrow), and broad-based decline in equities, I'd say it's a good bet that this is the "last" of the excess liquidity being drained out of the markets.
Whether or not the markets will recover after this is anyone's guess. A big hit to the system like this can really damage sentiment beyond repair in the short term, especially at the seasonally weak summer period.
It will take guts and precision to trade in this market. When equities take a 7% hit, it just might be time to buy for a quick 5% return on the bounceback.
Good luck.
-Tony
Tim,
Love reading your recommendations, but I I notice you don't put the CME much. Has it finished going down or too risky. Is it double topping with 450 a support area? Thanks for the OIH.
Peachy
Wow, what a day! Down 150 at one point. And 90 minutes left to go.
To answer the ProphetCharts questions - - ironically, it won't be in Prophet.net at first (or perhaps even ever). Not my decision to make anymore, folks! I'm an SVP, not the owner!
It's a fantastic product. The best thing we've ever done. I have drawn tens of thousands of charts with it and it still amazes me every day.
The ability to search for patterns isn't going to be in there for a number of months. It'll get there, though.
"ironically, it won't be in Prophet.net at first (or perhaps even ever)"
Try this: Go the the beta version and put up a multiyear line chart. Zoom in about halfway or so. Now start to move the chart by clicking the button at the right of the scroll bar. Watch the line where it ends at the last day or so.
When I do this, the chart becomes unstable as hell. The line moves all over the place.
I've tested the beta version for a while, off and on. Pro: it produces charts like oil paintings...works of art.
Cons: lots of bugs still and NOT suitable for daytrading anymore. Takes forever to annotate a chart. Used to be able to whip through a lot of charts very quickly, and with a lot less clicking around to zoom in and out, draw trendlines, monitor a bunch of indices etc. Also very slow to load, and WAY too many fly-outs and too many ways to get to the same thing. Some of the menus have been moved to awkward, harder to access sections of the screen.
The current java version had some problems, but relatively minor tweaking could have solved those (for example, why does it take two clicks to load a chart out of watchlist? (Yes, I know I can sequentially move them with the arrow at the bottom. But random loading takes two clicks. Why not have the chart name light up with a cursor pass, and load with ONE click? Why is the big yellow box still there? Try having 4 small cloned charts on your desktop. Then move your cursor over your screen. Watch all your little charts covered and obscured by big yellow boxes! etc. etc. etc.
Accuracy: Prophet charts have a reputation around the net for having serious data errors. That's true. For the worst examples, check out some currency charts. Entire months are missing. Lots of mistakes in stock charts, and some horrible discrepancies between intraday and daily charts for the same stock. (File under: "Gaps and things that are/aren't really there, and will blindside you while trading". )The data guys are slow to respond to spikes and errors, and sometimes don't bother.
TA: Could there be anymore obscure and little-used indicators available? Will commonly used indicators such as VWAP, which everyone watches, ever be available? Could there at least be a center line for Bolly bands? Will the index symbols that are allegedly available ever actually BE available?
If you want to see a decent selection of symbols, for free (daily charts for 3 years only) try StockCharts.com. After 5 years of subscribing to Prophet, they will likely be my next provider. I've changed my trading approach from daytrading to swing trading this past year with that switch in mind. If the prophet java beta becomes the only version available, and they ditch the old faster version, I'm gone.
What I've said above is only a slice of the problems with the beta version. Why don't I send them to the programming team? Did that, twice, and was told that half of my feedback was lost, because the feedback function wasn't working properly. Yeah, after 3 or 4 really frustrating, infuriating hours of trying to annotate charts with this overloaded, molasses slow beta, that's really what I wanted to hear.
Don't know why this version may not appear. Probably just as well, the way it is now. Definitely not ready for prime time.
A little note on gold:
As a trading/money-making vehicle, gold has certainly been producing nice gains in recent days. No doubt about that.
The only thing that concerns me about gold right now is the fact that there's no fundamental basis for its rapid rise. Speculative money flowing into gold based on fear and turmoil in Israel is what's causing it to rise, not supply/demand issues or currency hedging. This is akin to the speculative money chasing all of the Dot Com stocks up into the stratosphere based on "hope" that they're doing the right thing. Also, a huge part of the Dot Com Bomb was the fact that FUND MANAGERS were dumping huge amounts of money into those stocks for fear of being left behind. Hey, you gotta invest in what's hot, right??
Anyways, I suspect the same thing is happening right now in gold. Look at all the BUY recommendations given to gold by virtually every investing website nowadays. And the new ETFs make it easier for money to flow into gold. Pension funds are buying into gold. It's absolutely insane. Yes, it *IS* another bubble, albeit a more rational one than the Dot Com bubble.
I half expect gold to drop just as fast as it ran up. But then again, you never know how the emotions of investors will grab hold. People may be afraid of "missing the train" on gold and pump even more money into it to drive it higher, once again based on fear.
Fear is not a stable base from which good investments are made. But if you're making money on gold right now, just make sure those profits don't evaporate if the fear suddenly subsides in the next few weeks.
-Tony
Credit due to many of the regs here for sticking to the bear tac. As commented here, I didnt think a drop would happen yet, but here it is. Where it goes, only Tim will tell, because after all, he is KING OF THE BEARS!!!!
What the heck is going on with OIL afterhours... we are at 77.60
THIS IS INSANE.
Something bad is happening! Well I can think of at least 20 things. Interesting to note that OIl stocks and drillers are not doing well....
Hurricane, you're really grasping at straws to mention information like that.
We're going from a cyclical bull market to a cyclical bear market, all within the broad context of a SECULAR bear market.
Saying that the Dow is up 1.1% after nearly 7 months is really nothing to brag about. Make no mistake about it, we ARE shifting into a cyclical bear market. Nobody ever said it was going to be easy (nor quick).
Nobody is predicting an all-out market crash, a la 2001, but the fact of the matter is that the broad markets will sag (as I've said many times before) throughout the rest of the year, with sparse (and powerful) rallies mixed in between.
I wouldn't be surprised to see some really BIG returns for the longs in weeks or months towards the end of the year. But the bottom line is that I expect the major indices to be LOWER than they are right now. And certainly much lower than the 11,700 peak in May. So, your 1.1% gain will very probably be -1.1% on the Dow by year's end.
The action in the global economic scene in recent months has made it clear that people are gradually shifting their money OUT of equities and into other investments. Probably commodities, from the looks of it. Now, the only question that remains is: when will the money shifting come to an end? When the Big Boys finally get their monies repositioned into new investments, THEN AND ONLY THEN will we (the lowly retail investor) find out where their money went.
You can take a good guess right now and pump some money into commodities (gold, metals, oil, grains), but since they have had a big run lately, it might be wise to wait for a pullback.
I've heard some rumblings about the long bond becoming a decent investment, but I don't know that much about the economics of bonds, so I'm staying away for now.
-Tony
Hey Tim, thank you thank you thank you!!!!!!!
You give me direction and I take it from there buddy my trades are in the 90% win range I love prophets.net and Your blog.
Thanks everyone - Jim Chan, Old Soldier, etc.
Anonymous (Tony, I think) I'm surprised at your impression of ProphetCharts. Feel free to write Brett at Prophet.net with your input. I've find ProphetCharts to be rock solid stable but that of course does NOT mean your problems are to be ignored!!!
Nope, wasn't me (Tony). I haven't used ProphetCharts yet.
Anyways, has anyone seen the DJIA futures yet??? Down 197 points!!
Nikkei down 150 points already.
U-G-L-Y
-Tony
Ok, those numbers didn't last long. There was obviously something wrong with CNN's market reporting page.
Now DJIA futures are down 26 points, which is more reasonable.
Nikkei still isn't reporting yet; the CNN time table is way off.
-Tony
How did Oil go from 75-78 in a day???? Sounds fishy....
DHI missed tonight- the situation is worst then what was priced into the market....
PPI,CPI, Fed minutes, and bernanke next week.
Here is an idea... Rambus is reminding me of Enron. They can only report revenue now because of investigations. And they were going to miss badly..... P/E of 74 +no growth or earnings... the multiple is higher then GOOG. Just and idea.....
http://yahoo.reuters.com/news/articlehybrid.aspx?storyID=urn:newsml:reuters.com:20060713:MTFH23430_2006-07-13_23-11-42_WEN1071&type=comktNews&rpc=44
Futures down right now, this is not looking good. I think we could test June 13 lows of 10650-10700 before seeing a bounce. GE reports tomorrow and if they dont show positive results expect another sell-off, however I think we could have a bounce, not a bounce thats going to bring the dow back to 11300 but a bounce that could lift stocks 3-5% on avg. Markets will look somewhat oversold at DOW 10700 and NASDAQ 2025.
Craig
DHI huge miss, all the home builders are going lower, for anyone to think this sector is going to pop back up when the federal reserve stops raising rates has to be stupid. The housing boom is over, housing prices should fall 10-15% in the next 12-18 months.
Craig
DJIA futures down 23 now. Nikkei is taking a HUGE beating -- down 225 right now.
I REALLY like the RMBS short. I agree -- there's no way in heck that RMBS won't see at least a 50% reduction in share price over the next 6 months. I just don't see any way it could possibly go higher.
I also agree on DHI. Short at will. There's no way it goes up from here. Well, at least not PERMANENTLY.
Thanks for both of those ideas.
pb: regarding gold, what am I wrong about? Do you think this price rise is sustainable?? 20%+ in a couple of weeks, with huge gains happening on a daily basis?
If you look at the chart, it's even steeper than the last speculative runup which was driven by short covering and hedge fund buy-ins.
A 2+% rally today in gold because a few missiles are thrown around?? Come on. On 9/11/01, gold only went up 5% on the day, and actually went right back to where it started within a month or so.
While I do agree that gold is going higher (much higher), I completely disagree that *THIS* is the start of the run.
If I'm wrong, then I'll probably miss out on a 10% gain from here, as I plan to buy in after gold clears its peak at $720 if it doesn't come back down. If gold goes to $720, then there's no way it won't hit $1000 or more (which is another 50% gain from my buy-in point).
But if I'm right, and gold corrects to the $590 range again, then things will be rosy all over.
Good luck to you.
-Tony
"Anonymous (Tony, I think) I'm surprised at your impression of ProphetCharts."
Wouldn't really call it an impression. More based on 5 years of very close observation and use. The beta IS unstable (did you try my suggestion with line charts?), and the current java has recently had some problems with lines shifting when zooming (I reported that via live help, and got it fixed).
"Feel free to write Brett at Prophet.net with your input."
Again, at this point, why bother. (The fact that the 'feedback' function didn't work was pretty much the last straw for me. I'm actually quite surprised at myself for even giving the partial rundown of problems above.)
"I've find ProphetCharts to be rock solid stable..."
Repeat, try the beta line charts and observe closely.
Lastly, Brett has NO control over what the data guys will or will not fix. As well, the accuracy of the charts is a big issue for me. I don't like having to check every gap, high, low with several other sites to make sure they really are what the chart says they are.
Here's a very recent example: $compq: 60 minute chart (or any intraday chart). Thursday's high is allegedly 2088.24. (Yahoo historical prices have it as 2090.24.) Given that Wednesday's low was 2090.24 (2090.23 according to Yahoo), this leaves a Wed/Thur gap on the intraday chart.
Now go to daily chart. Miraculously, the low for Wed is now in accord with Yahoo: 2090.23. The high for Thursday is now 2090.24, again in accord with Yahoo. The gap showing on the intraday chart has now vanished!
This isn't an isolated error. I find these on a very regular basis. Nor is it the only error type in the charts.
Not ever safe to only look at one timeframe, of course, but isn't this asking too much of users? Shouldn't traders be able to concentrate on trading, instead of having to constantly 'groom' their charts for errors? And doesn't this support my argument that the old, faster java version should be kept active, seeing as how users are forced to scan all timeframes in order to identify these errors?
IMO, if and when StockCharts offers streaming charts, Prophet will have some very serious competition.
Post a Comment