Charts for Yer Shorts
This one's simple, folks. I've got puts on all these. And I love 'em. Enjoy.
APA: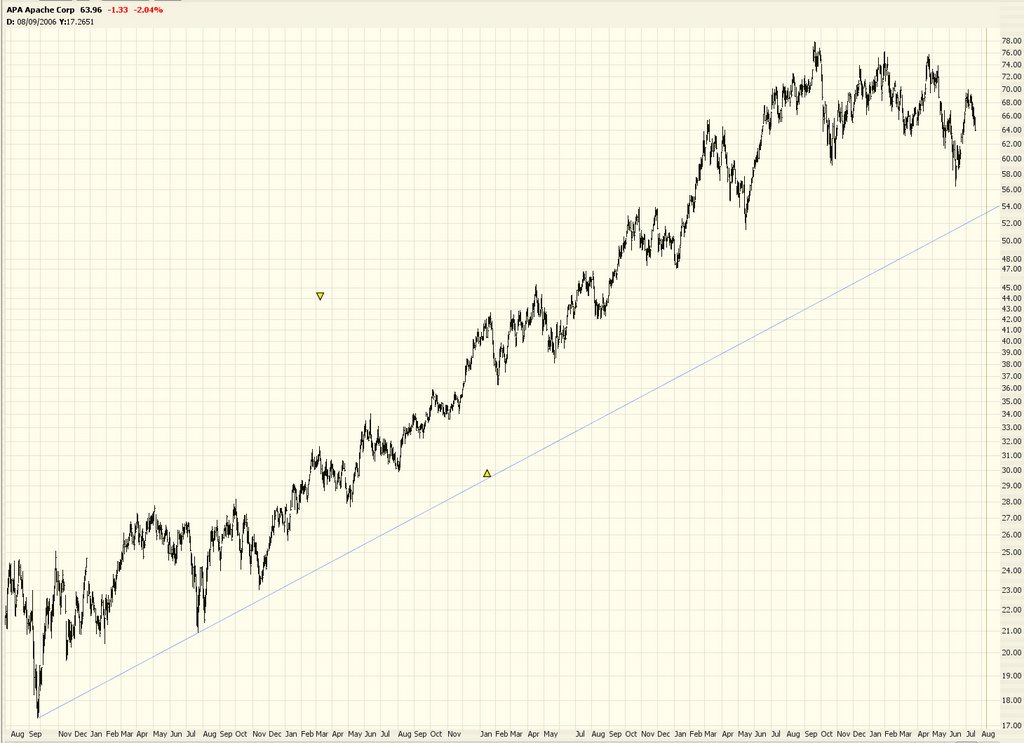
BNI: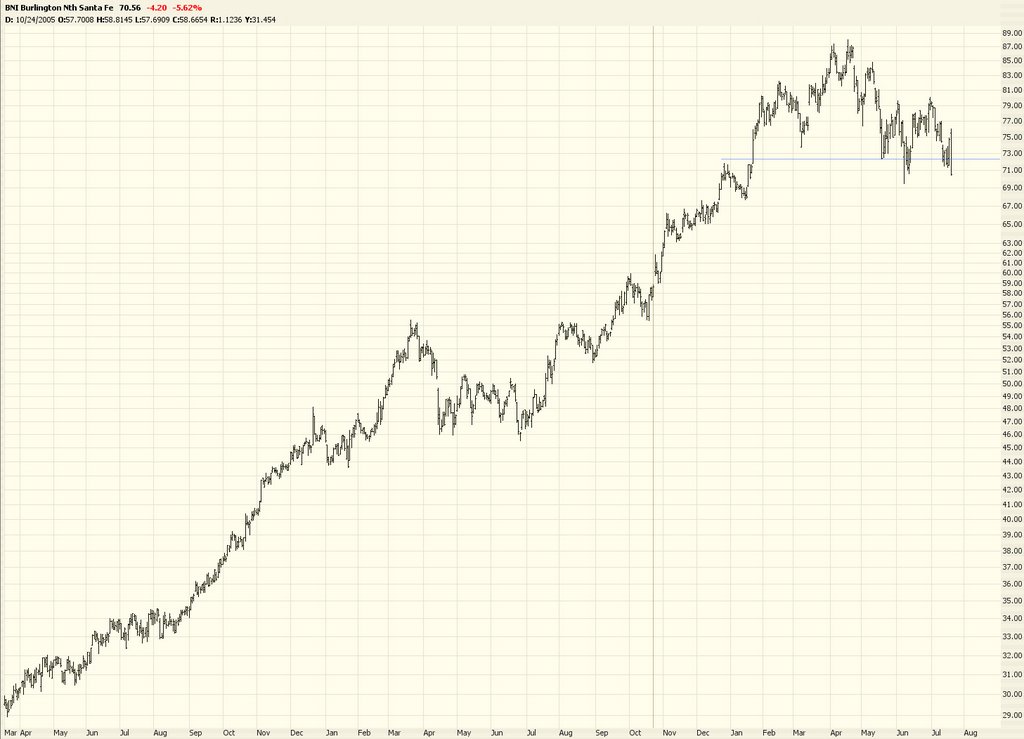
CX: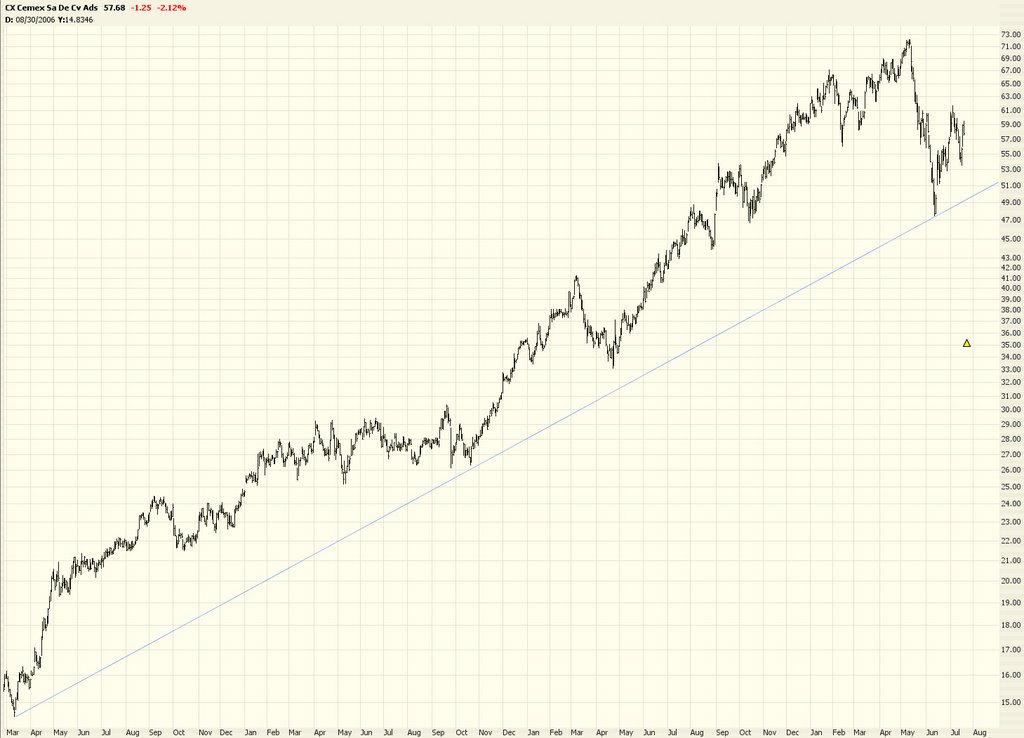
DO: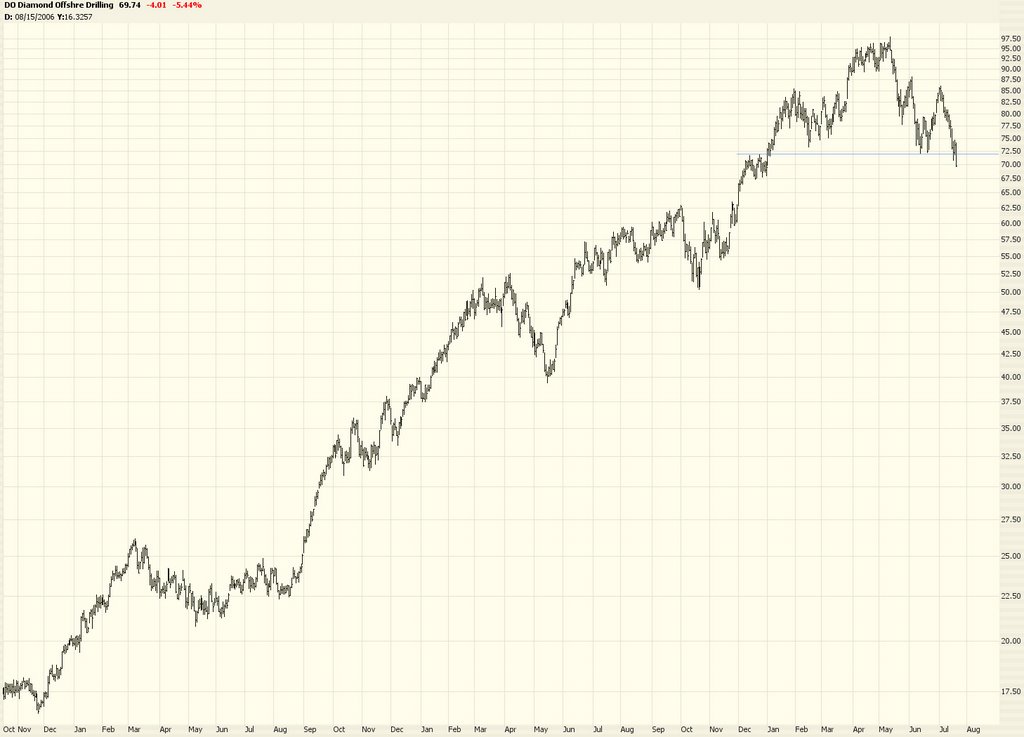
EOG:
HNT:
MRO:
MON: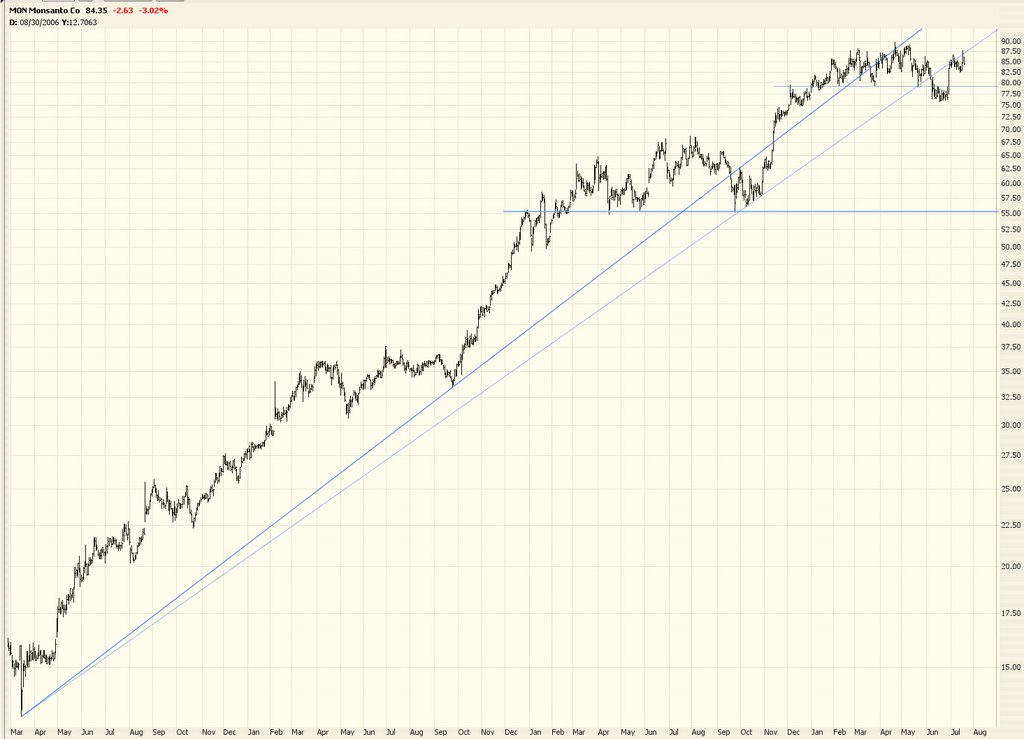
NXY: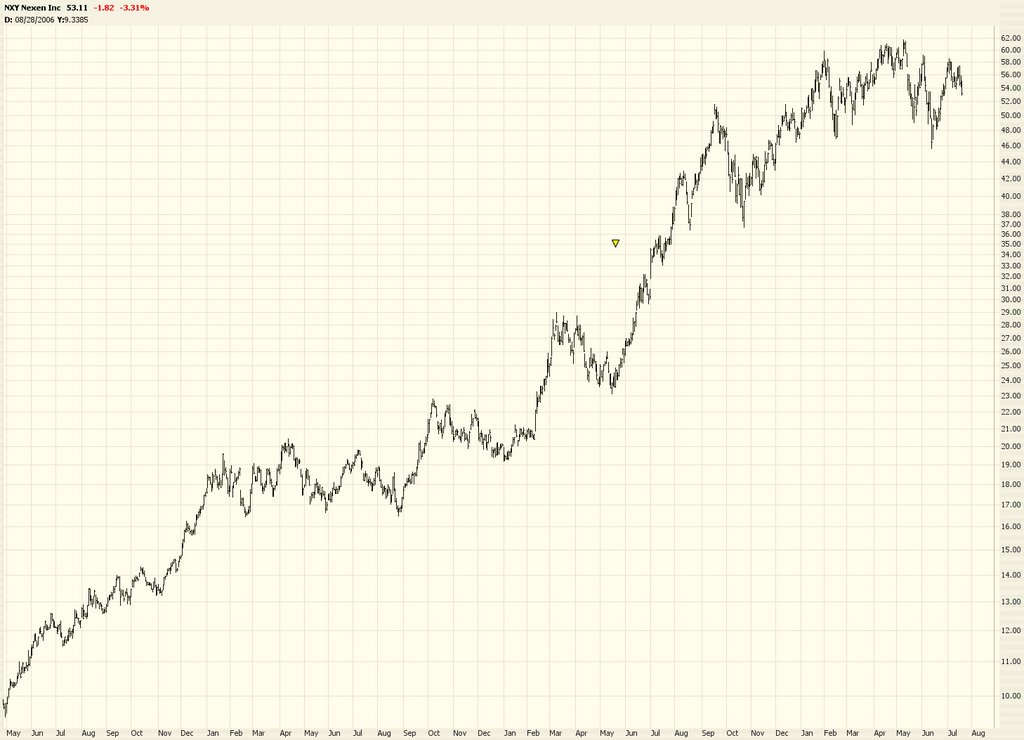
OIH:
PBR: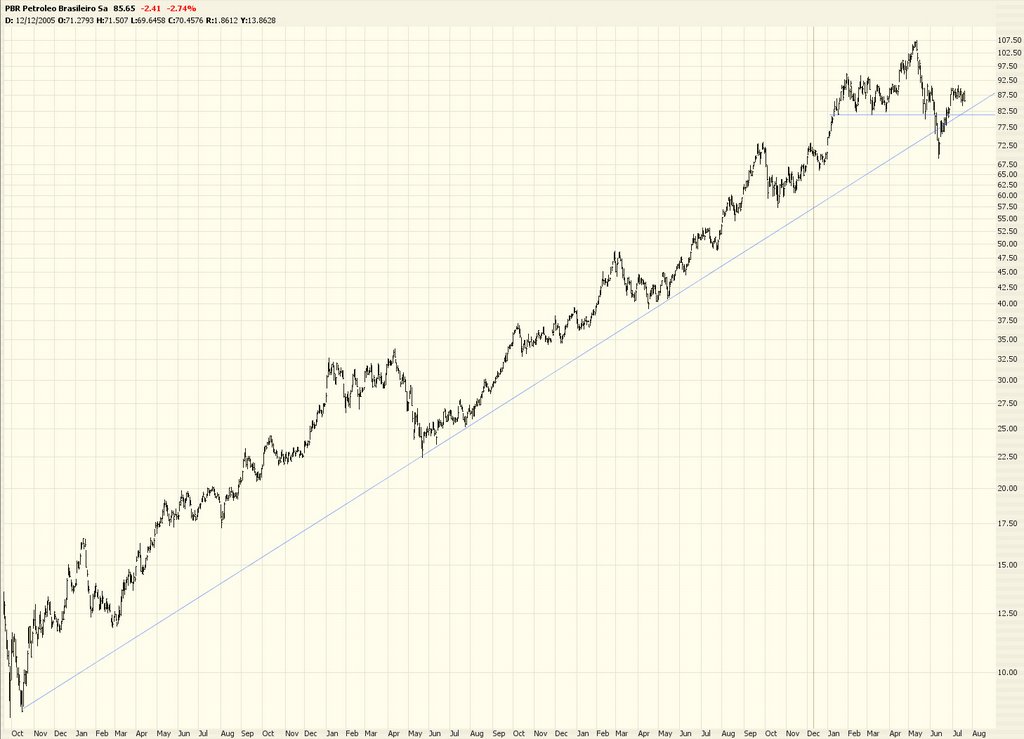
$XAU: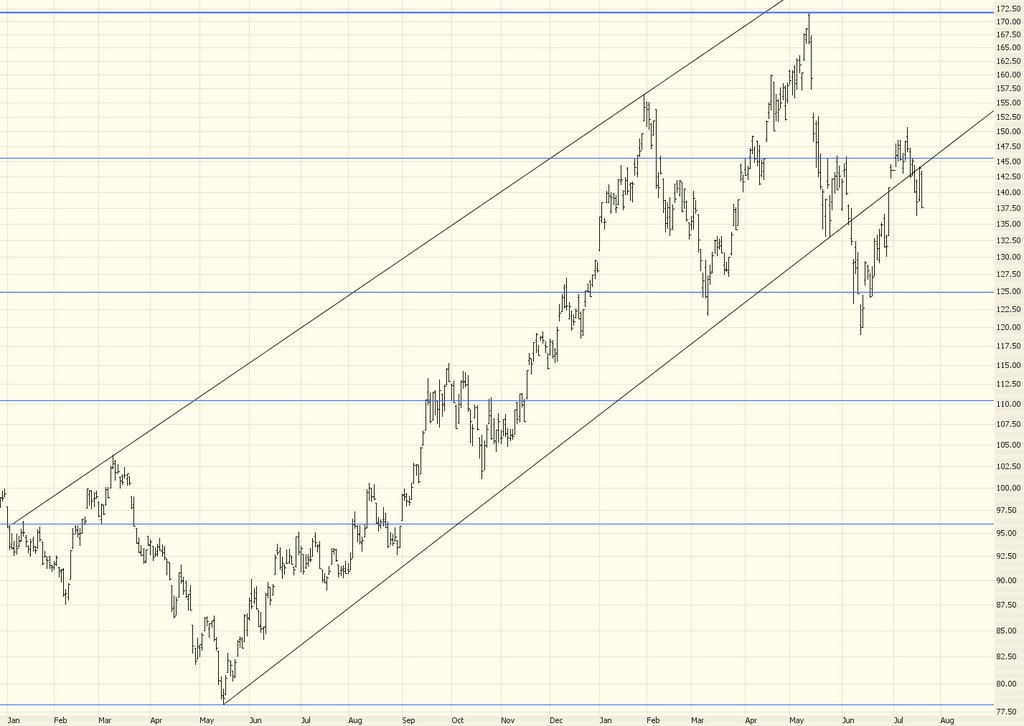
Cheers.

This one's simple, folks. I've got puts on all these. And I love 'em. Enjoy.
APA:
BNI:
CX:
DO:
EOG:
HNT:
MRO:
MON:
NXY:
OIH:
PBR:
$XAU:
Cheers.
21 comments:
How do you play $XAU short??
Thanks.
too bad goog came out with BLOWOUT numbers.
"How do you play $XAU short??"
Buy puts!
Pop quiz time for all you smarties!
The US consumer accounts for 20% world GDP, the US consumer is cutting back spending. What will happen to the US stock market?
1) Rally to all time highs.
2) Nothing.
3) Fall out from an 11 storey window.
Droog shorts GOOG?
what goes up must come down. ill play the dont ! thanks Tim !
chronictown
Tim
Thanks for the early morning laugh! Love the work.
David
Looks like longs in the market are getting the old "in-out, in-out" today.
:)
HAL reported disappointing earnings. Not good for the OIH.
bsi87, you're making money hand over fist here. Congrats. Wish I had the courage to do what I KNOW needs to be done in this market. But for some reason I just can't bring myself to pull the trigger. I guess after watching the action from the sidelines for the last 3-4 months (I sold out of my positions in April), I've lost the trading edge.
-Tony
PXJ looks like a buy soon. Wouldnt mind buying some of PXJ around $18
Yikes, has anyone seen the volume today?? It's huge (relatively speaking), especially for a Friday.
To this point in the day, the Dow is way above the volume on Wednesday for the morning session.
Look at the 5-day line chart for the Dow... you can draw a perfectly straight resistance line along the top. Looks like program selling and big money is heading for the exits in an orderly fashion (as I mentioned yesterday).
"Nothing to see here, folks. Move along."
-Tony
BTW, bought a small starter position in GLD today near the lows. It will definitely be time to accumulate more heavily under $60. They're starting to push gold down already. I hadn't expected it to start for another several weeks.
Yes, I know it's options expiry today, which can account for some of the heavier volume. But it's not "choppy" action, it's clearly a steady selloff. And I'm also looking at the straight decline in the Dow as a more significant signal.
-Tony
how come the other day when the markets were in rally mode everyone was saying nasdaq 2150 and dow 11300????????????????????
there were few fools in here saying the markets were going higher. Where are you now that the market has sold off 2 days in a row??
I really dont comprehend where you pulled those numbers from. Pretty sad to think we were going higher.
Markets have no where to go but DOWNNNNNNNNNNNN
need to break 10,600
bsi: of course you're going to have a diverging MACD on the 2nd and 3rd attempt at 10,650 because the change in the moving average was much, much less than it was back in June. I don't think that says a whole lot. I agree, though, that the 10,650 level is key for the Dow. Either it breaks down or trades sideways forever until the P/E's (ie., change in market sentiment) come down due to earnings catch-up. That would just suck.
I'm not trying to pick a bottom for GLD. It definitely looked weaker than usual today and took a huge hit in late trading. I just wanted to start a position in case of a head fake. I fully expect GLD to pull back further, possibly to the $56 range. But just in case it doesn't, I want to at least have some exposure. Besides, the $620 level has been tested and has held several times already. It's a minor support level, which is why I only took out a small position (roughly 1/4). I'll add another 1/4 at $590 and the last 1/2 at $540 if we ever get there.
If gold goes below $500 after I finish building my position, then I'd be in a bit of trouble, but then again, something would have to change significantly in the global economy for that to happen.
Not that you asked, but I thought I'd share my viewpoint on gold in case anyone wants to discuss it.
-Tony
I agree that there should be a better short setup soon. Lots of technical people are calling for "the short of the decade" in the next few weeks.
Yes, it's unfortunate that gold didn't hold its 50-day. But it's been at $620 before and recovered. And since $620 just so happens to be at the bottom of a trading channel that goes back to last year, I decided to take a shot today.
As I said, I fully expect gold to get back to $560. And I plan to buy on the way down as I mentioned.
I'll be watching the VIX closely and probably try going long on any reading around 20 or higher and short at around 13-14.
-Tony
agree pb, one more 2-3% rally then its downnnnnnnnnnnnnn
so Tim's a clockwork orange fan....nice
Think we may see a minor bounce in the Nasdaq back to 2100 tops. Then its down, however I think there will be another 5-7% rally in the markets before the next big drop. I dont think its straight down from here. Think a late summer rally followed by heavy selling in oct-nov.
major sell signal on the small cap sector.
There are some good comments hear. The most rational appear to recognise there will be a further spike up, probably next week and possibley as short in duration as this weeks has been ie a 2 day wonder. After thats out of the way, the real downward trend should start, although there will still be brief rallies. Gradually even the most hardened bulls will end up selling into whatever rallies there are. Again good observations here - the 10600ish restitance to go downwards, as to the upper resistance, that now seems to have firmly slipped to 11000, down from a previous consensus of 11200 to 11300. Goodness knows what next week will bring, but what a roller coaster ride this is....if your day trading in particular
NAILED!!! DIA smacked right at 108.56, which just so happens to be where I drew a trend from about 3-4 weeks ago before the "head" (is it a true h&s yet?). Upward trend from 101.63 on 2/1/2006 ended today @ 108.69, downward trend 112.84 on 6/2/2006 ended today @ 108.55, both converge next week.
The interesting thing to me is that DIA dropped very quickly to the upward-trend today and then bounced between the two, with a few high bounces that went over the downward-trend.
If it follows that same down-trend, we are looking at 104-105 for the Aug option expire.
If you can't tell, I don't delete very many trend lines. It's that whole "history repeating itself" thing. Or at least there are lines that seem to come back into play days, weeks, and even years from when they started...
Post a Comment