
Oil Spill
Well, here's a trade I blew big time!
Over the past several weeks, I had taken various short positions on oil, particularly oil service stocks. One of my favorite trades was buying puts in the OIH ETF. It's liquid and able to move large amounts.
Almost all these trades were profitable, but I figured that, short term, the move had played itself out. I based this on examing the Fibonacci retracements for OIH, and it seemed that the price was getting right onto resistance: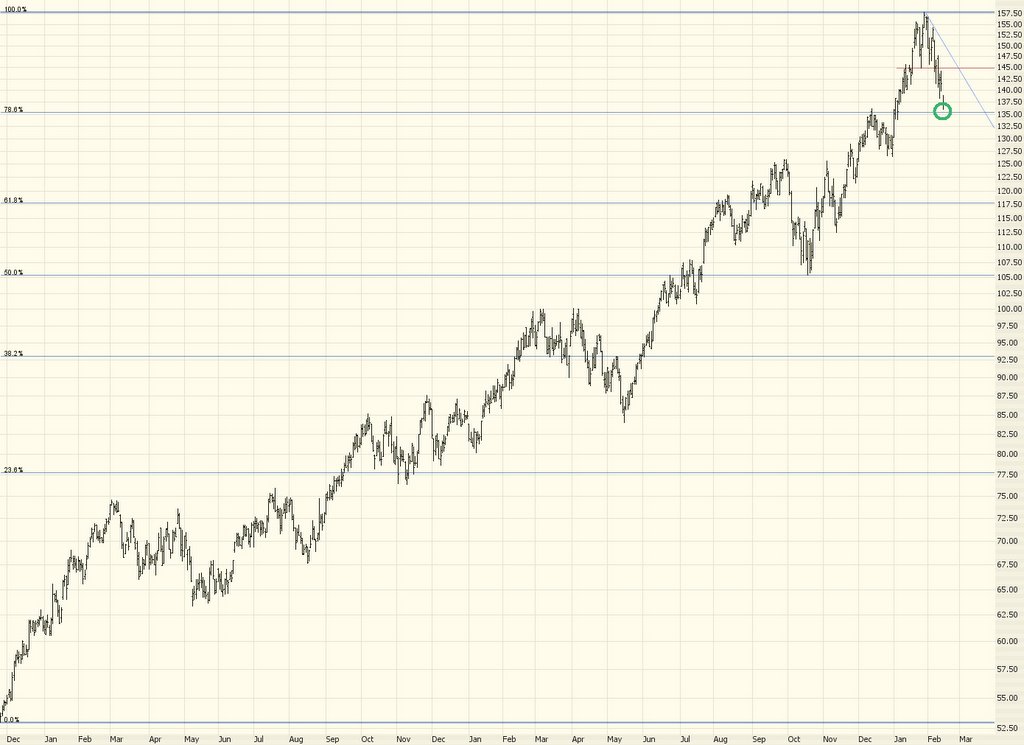
Unfortunately, my temporarily bullish stance on oil was blown out of the water as crude oil fell below its supporting trendline. The graph below shows the continuous contract for crude oil over the past several years, and although this graph doesn't shows today's price bar, the price did drop substantially below the supporting trendline.
Besides OIH falling, many high-flying oil service stocks (like HP, shown below) have taken quite a dive (highlighted here in green).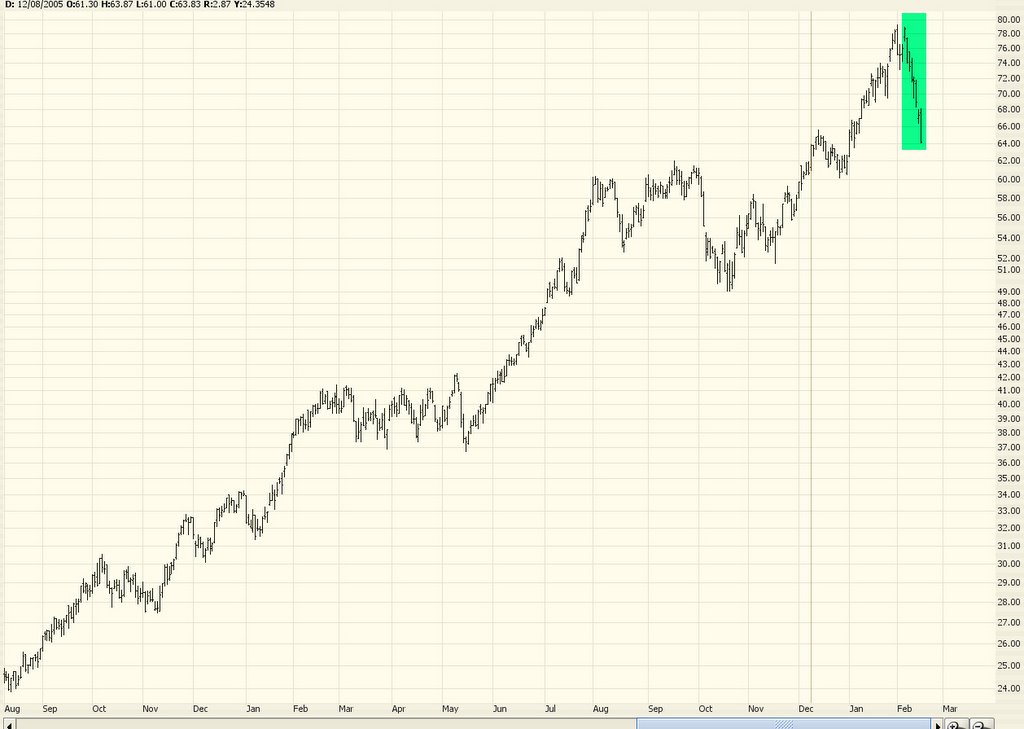
Since OIH is below its Fib retracement level, it's entirely likely it'll continue falling to the next level below. At this point, I'd steer clear being long anything to do with oil.
3 comments:
It would appear TA for stocks, or similar trading investment, would be a proper analytical medium for computer programs. If this be so, has any such computer program been consistently able to outperform the respective market it is analyzing on a real time basis? If not, why not? I am not flippant, but seriously questionable.
Thanks
The day we start trying to make "perfect" trades is the day we magically become unprofitable!
To respond to the question of anonymous -- well, there's no magic program out there, but there's an entire industry based on mechanized trading. One site you may find interesting is http://www.collective.2.com
Post a Comment