
Bye-Bye, DIA
Well, the price of the DIA has blown above its resistance level, meaning the entire diamond pattern is invalid for the bears.
Indeed, the diamond pattern is a two-edged sword. So just as it is a strong harbinger of lower prices if violated to the downside, it likewise speaks to higher prices when violated on the upside. The psychologically important 11,000 on the Dow is being challenged again as well.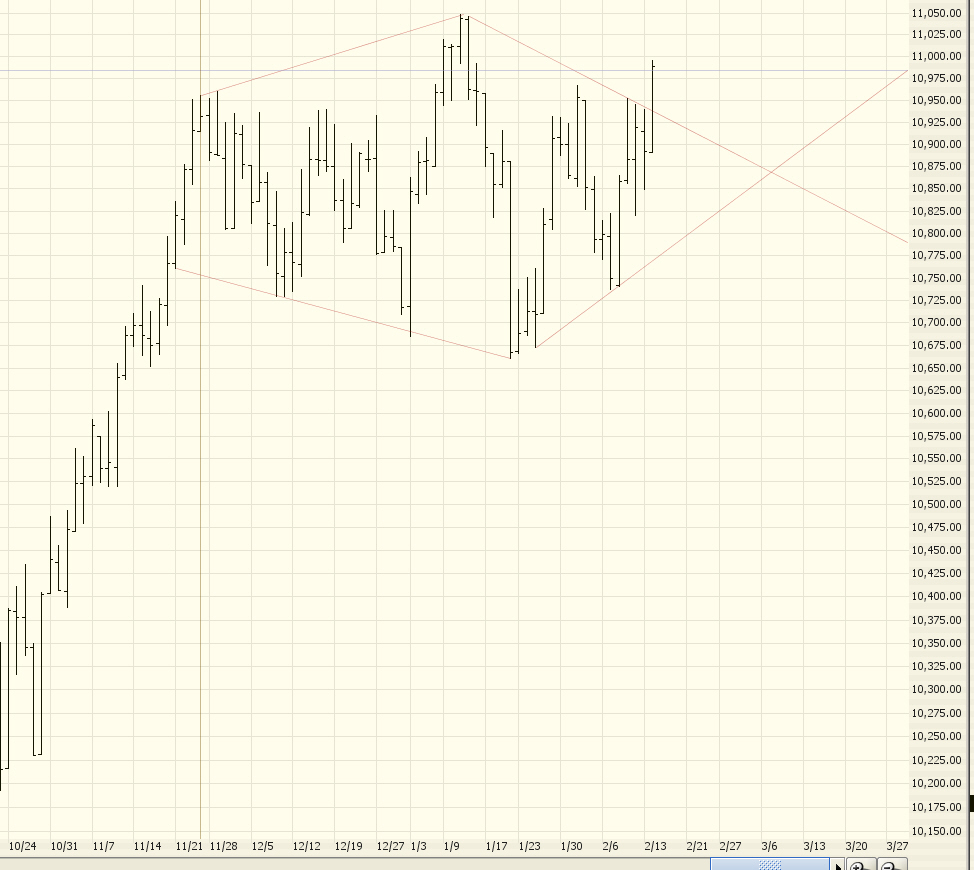
As a side note, I'd also mention GOOG might be a short-term buy at this point, with a stop at 341.88. It's fallen almost $140, and it's received a ton of widely distributed bad press lately, so for now a lot of the selling may have been wrung out of the stock.
10 comments:
We'll have to see whre the DIA closes, but this could very well be a head fake, get all the bulls excited about DOW 11K, then wham, down she goes! I think this complacency is just further testament to how bad things will really get. Minisclue Q4 GDP? Oh, great, let's buy stocks. Lowest savings rate since the depression, doesn't matter, let's buy stocks. Inverted yield curve? Oh, interest rates 'don't matter anymore' This seems like a pure replay of the tech bubble. Wild explanations why the bad data shd be ignored. I think again the market is doing it's best to confuse the majority of participants!
Well, you're right, we'll see. If DIA crosses above 110.46, I'm going to have to really reconsider my bearish stance. As a side note, oil (OIH, etc.) is looking like another good buy.
If you change your bearish stance, then the last bear will be a bull, would this not mean that there is no one left to buy and hence the end of the upmove? I seriously doubt any significant upmove here is possible The Dow is capped at 11,700 while the SP500 shd not see anything north of 1315. Let's just give time for Bernanke to mess things up for the bulls! I doubt the fed will stop with the markets approaching such lofty heights. If the market wants lower rates, it will have to give some ground.
Hey Tim: Just looking at your Big Picture post from Feb 03. Well, the Dow broke up through a pretty well defined line in 1987. We all know how well that played out. Today's 'break-out' will feed the bearish fire that much more!
Whatever happened to DOW 6,000? I think you are wrong on that as I see it dipping into the low 4,000's
I hope this latest 'upmove' hasn't shaken you out of your bear clothes! I mean what has changed? A lot of gift card holding shoppers decided to spend it in January ... big deal. The bigger question I would like to see the market come face to face with is the NEGATIVE savings rate. Doesn't that worry anyone else?
Hey, I'm as disappointed as anyone! But the chart doesn't lie. The DIA shoved through the resistance line and didn't look back. The NYSE Composite hit a lifetime high. I'm having trouble seeing good news (e.g. arguments for a short-term fall) here. If I had any influence over the markets (which I don't!) I was hoping the line was going to fall through support in just as dramatic a fashion. ~Sigh~
Well, if this move is for real, it's gotta come back and test it. Right? But really, how high can this market go, given the long stretch this bull has run? oh, the poor retail investor, how they will get sucked in once more!
Trader Tim, now you're talking. Glad that you finally convert to a bull. Take it from an old pro, it is much easier to make money from the long side than the short side. I reiterate my forecast again, GOOG will be the first one trillion dollar market cap company in the world. And $INDU will be above 12000 by the end of the year because the economic fundamentals are rock solid.
Wow. I've seen you be bullish on individual stocks before, but I don't think I've ever seen you make a bullish sounding comment on an index.
I'm impressed!
Dear TraderTim: Yeah, it kinda sucks that the Dow broke to the upside from the diamond pattern, but it's hard to argue with irrational people! Anyways, what is the predictive power of the diamond pattern? The first break was to the upside, so does this mean that 100% of the time the market will be significantly higher? I know it's a rare pattern, but how good of an indicator is it?
Thx
Post a Comment