Friday, April 07, 2006

Rates Weigh Down the Market

Well, forget about this being bullish - even temporarily. The market is losing momentum, and all these hyperbolic charts are looking sick.

The interest rates are starting to weigh on the market. A number of weeks ago I pointed out that the Utilities were going to get smashed, and they have been. The head & shoulders pattern is crystal clear now.

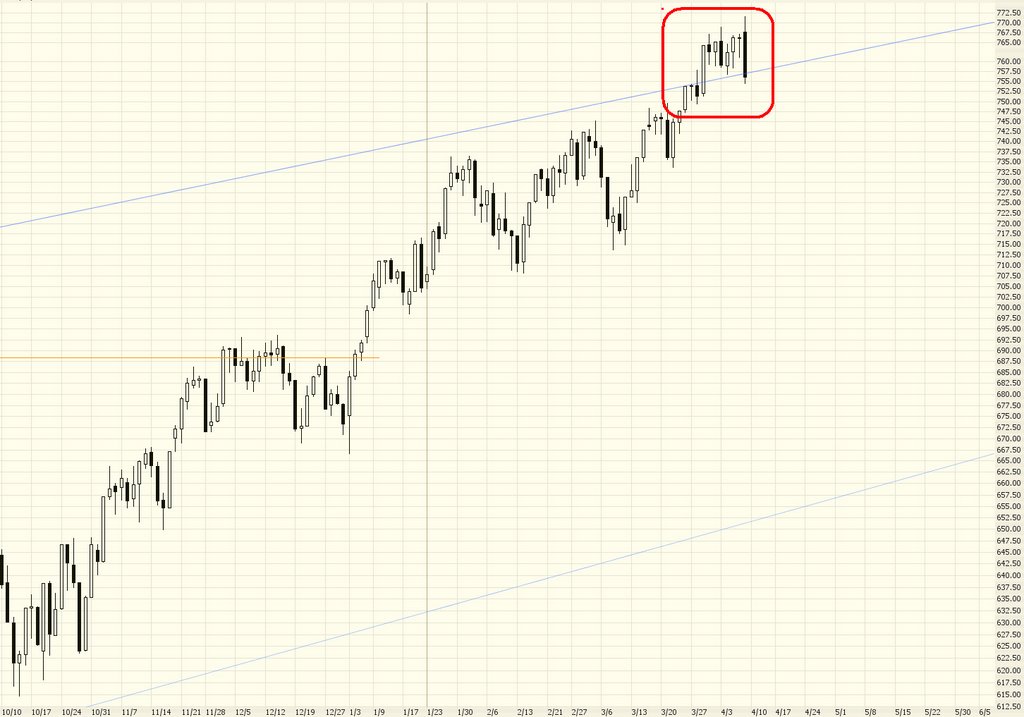
The reversal today was extraordinary. Below is the Russell 2000. The open was a new lifetime high on this index, and the close was substantially below it. The portion rectangled in red is the "churning" that's been taking place above the former resistance trendline. It will need to smash below this decisively to clearly be bearish.

We've had good luck with Autodesk a couple of times before, so let's try for a third. This is pushing up towards a medium-sized resistance line. I'd say short this and stop at any price above $44.
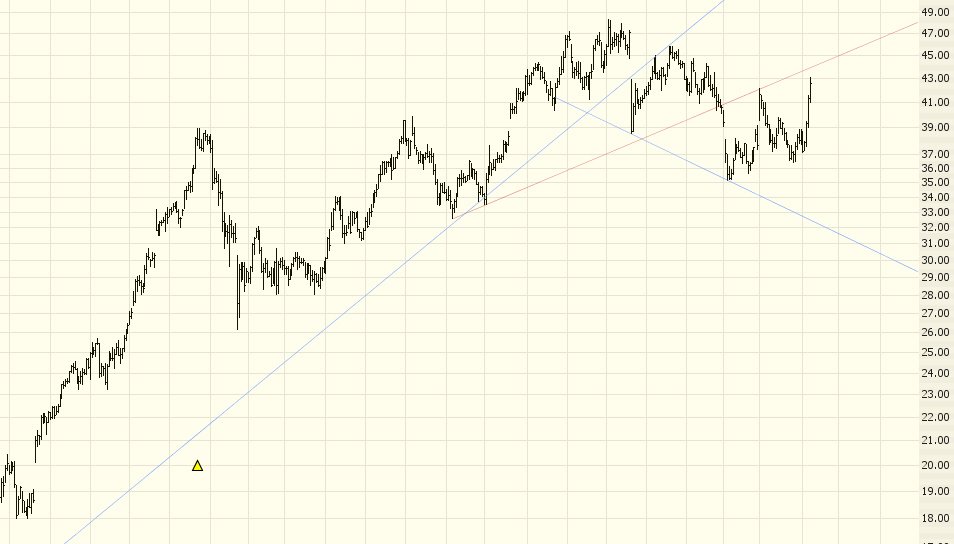

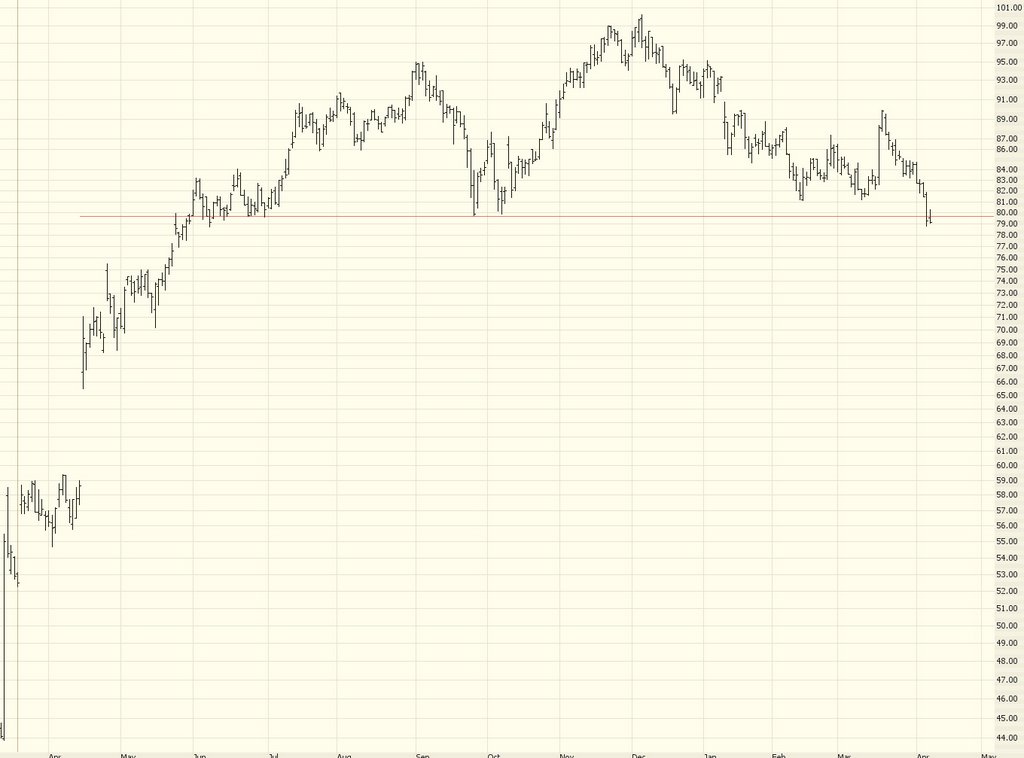
We've also been watching Genentech for a while, and it's finally broken its neckline. This is a pretty massive pattern, so it's fairly promising, especially considering the poor performance of biotechs over the past few months when the market as a whole has been pretty strong. I'd suggest shorting this one, stopping out at any price above $89.91.

Have a good weekend, everyone!

Thursday, April 06, 2006

Short Apple

I believe it's time to short Apple Computer (symbol AAPL). Close out any position if the price crosses above $73.

Below is a chart of Apple's entire trading history since their 1981 IPO (adjusted for splits, of course). I have highlighted in green five discrete "hyperbolic rallies", the most recent of which is the most dramatic and peaked last January 12th.


I'm not an Apple-basher, by the way. I bought my first Macintosh early in 1984, shortly after it was introduced. I worked at Apple for nearly three years in the late 1980s. And Steve Jobs has been my personal hero since I was a kid. So Apple is a great company with wonderful and well-polished products.

But their stock is atmospheric at this point. I would characterize the five tinted "hyper-rallies" as follows:


  • 1982-1983 - General high-tech rally; anticipation of Lisa & Macintosh

  • 1986-1987 - Post-Jobs ouster recovery and popularity of Mac as desktop publishing tool

  • 1990-1991 - Post-Kuwait tech rally and popularity of faster Macs, such as the IIfx (Multimedia)

  • 1998-1999 - Jobs influence on product line improves earnings and reputation

  • 2004-2005 - iPod rally, earnings momentum

You can clearly see what happened after each of these five hyper-rallies. The stock fell, and it fell hard and fast. The stock already started doing this over the past 10 weeks, although the past couple of days have pushed the stock up to a much safer level for bears. Here's the entire "iPod rally", where the stock went up more than ten-fold.


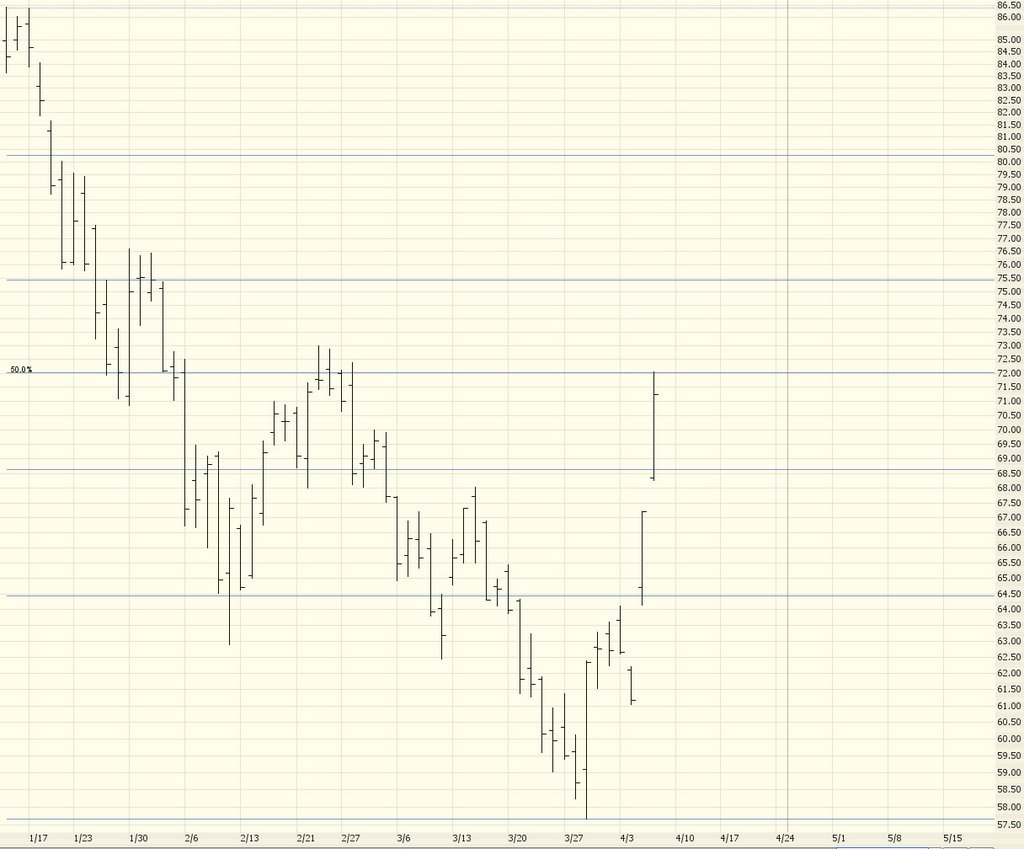
Taking a closer look at recent history, you can see the Fibonacci retracement closely aligns to the price behavior. Indeed, today the 50% retracement was nailed to the penny. I'd say this is a relatively safe high reward/low risk trade.

Wednesday, April 05, 2006

Bullish Charts for a Bullish Market

Maybe you think you're on the wrong blog, since I actually have some "buy" recommendations today. But if you can't beat 'em, join 'em, and I'm sick of fighting the upward tide.

The Dow Jones Composite hit a lifetime high today. It is currently 12% above its peak during the Internet bubble. The Dow Transports also hit a lifetime high today, and it is 23% above its bubble high. The Dow Industrials is still about 400 points below its lifetime high, and it needs to cross above 11,335 before that becomes a possibility.

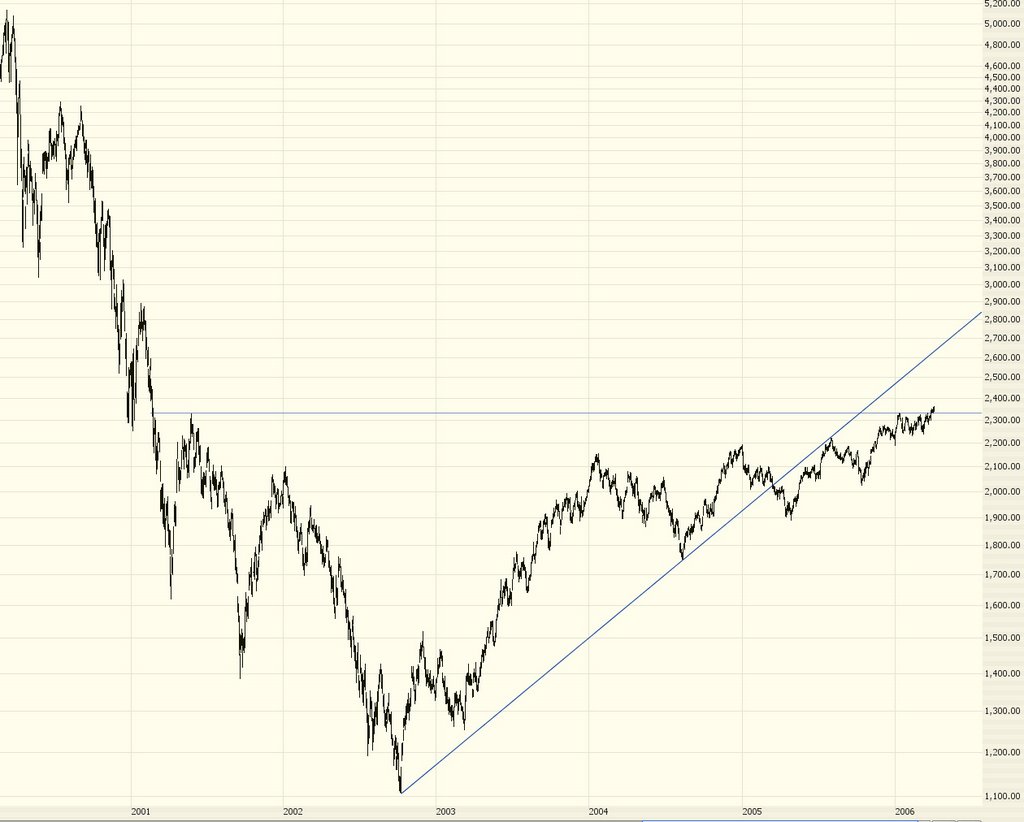
One compelling chart for a bullish case is this one of the NASDAQ Composite. It sort of kind of has an inverted head & shoulders pattern. Not textbook, by any stretch, but it keeps pushing its way into relatively clean territory.


The Gold market is one which seems clearly past its peak. The chart below shows nearly twenty years of data for the $XAU, and it seems to have hit a major top for the third time in a row (see circled prices).


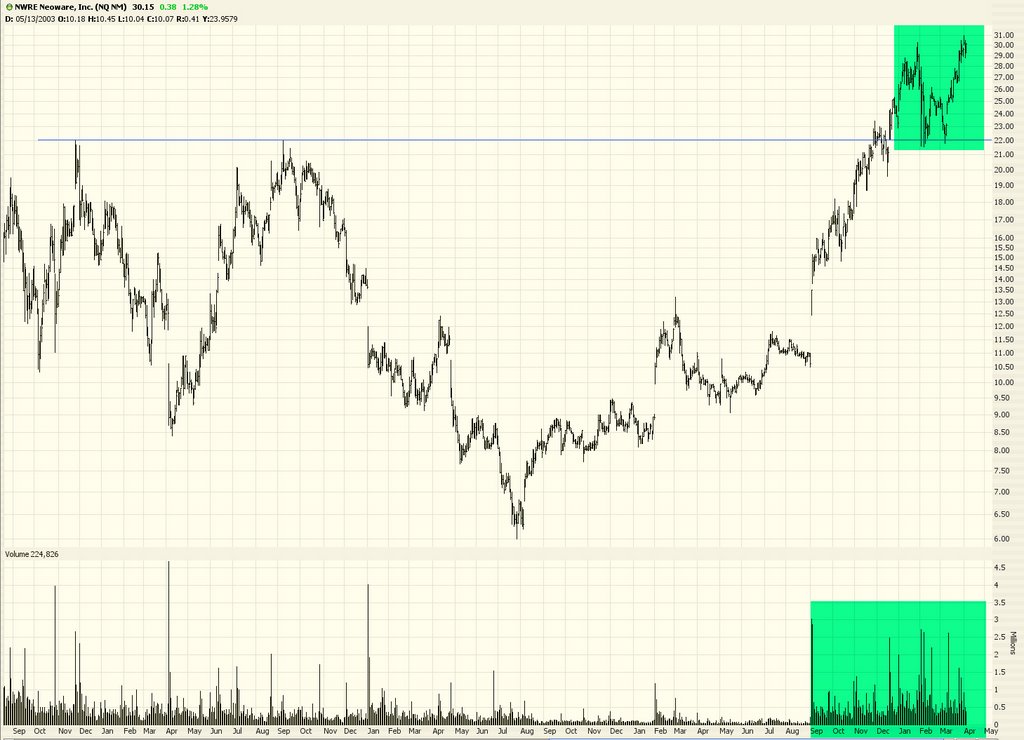
First recommendation is NWRE (stop price: 21.53; in all cases, the stop price cited means any price below this should generate a sell @ market order).


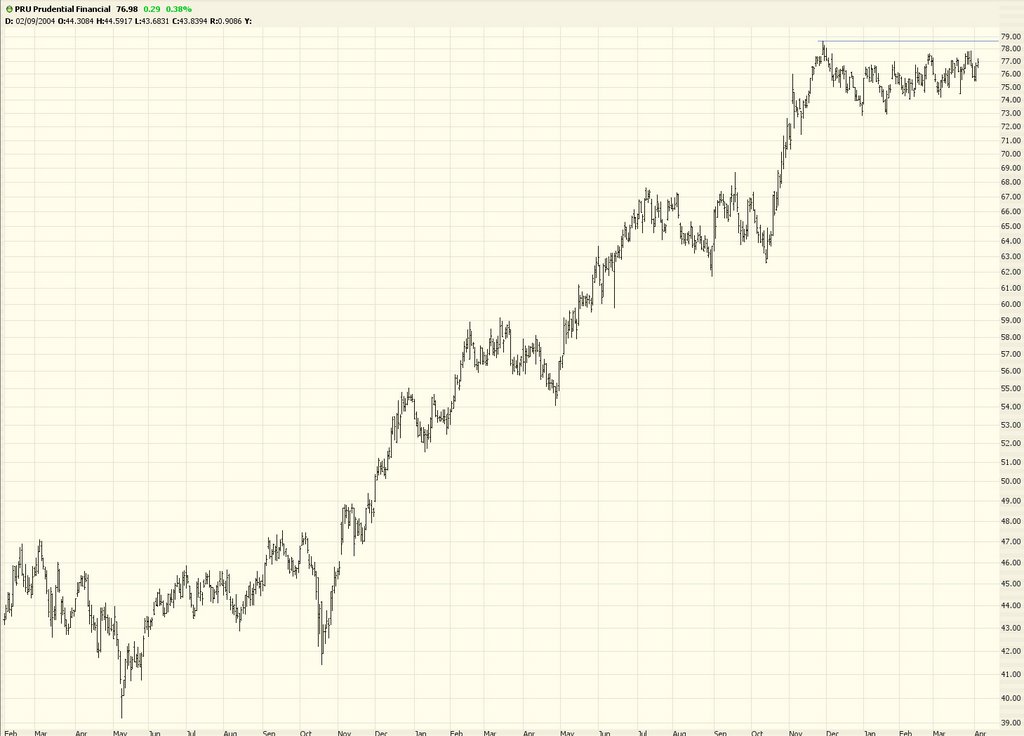
Second is Prudential Financial (PRU, stop price 74.52). I suggest waiting for a breakout to a new high before pursuing this one.


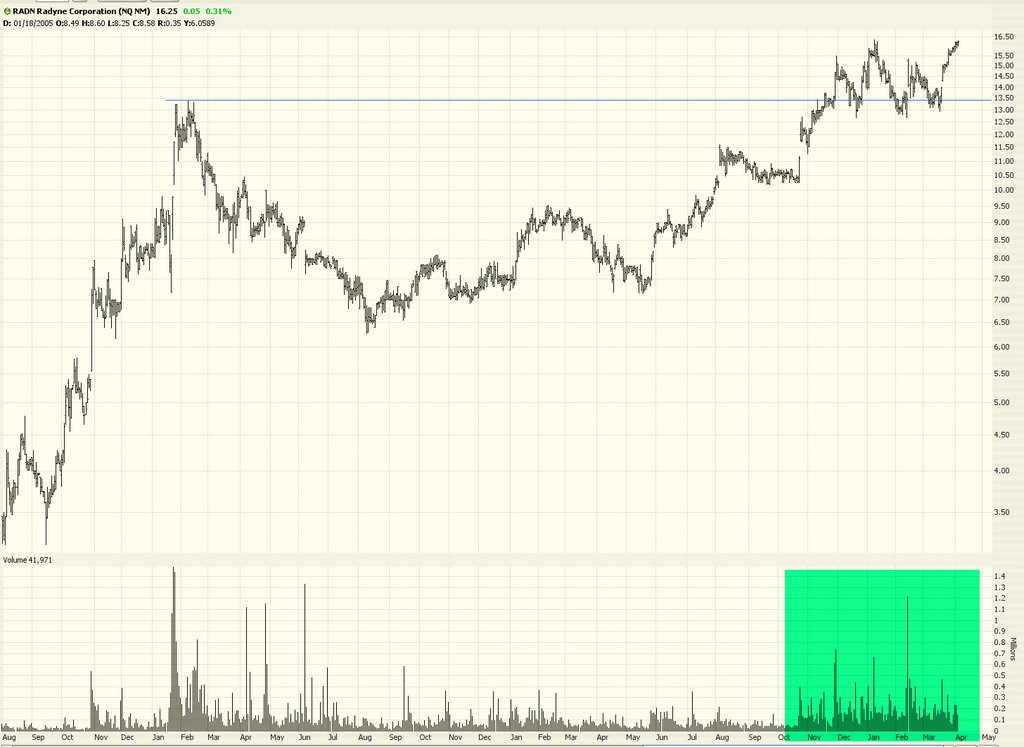
Radyne (symbol RADN stop 12.68) is next:


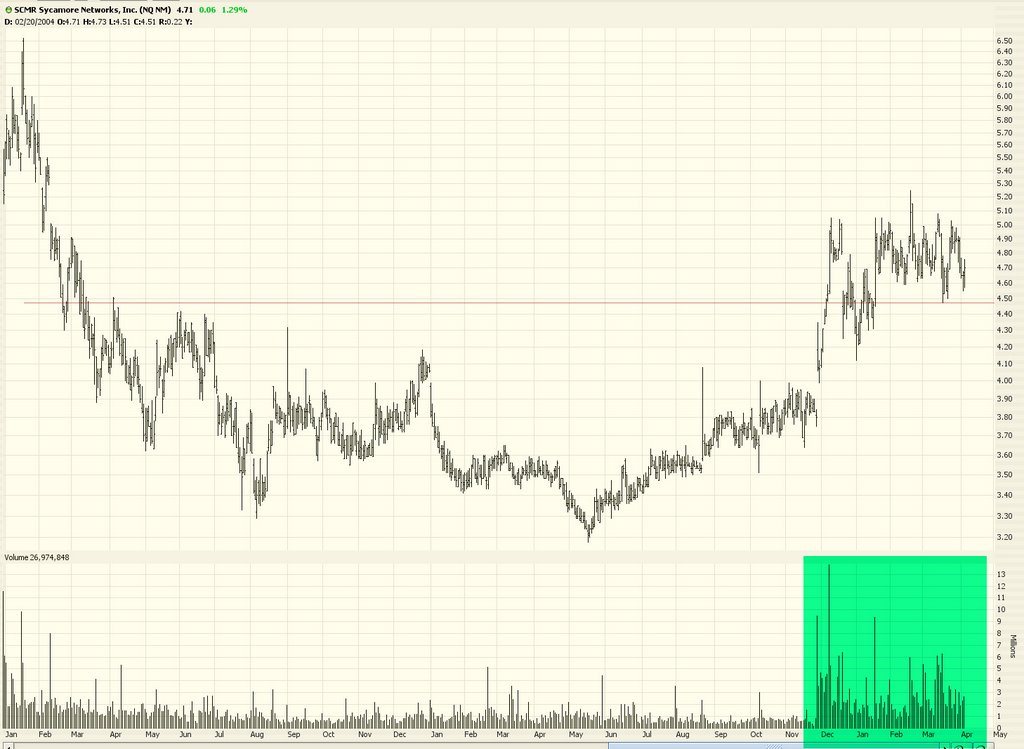
SCMR (stop 4.46) has been struggling for years. It needs to clearly break above this saucer, but if it does, it could mean a major move.


Lastly is TradeStation (TRAD, stop 13.33) which not only has had great price action lately but also a sensational increase in volume. Always a powerful combination....