Wednesday, May 03, 2006

Topping Out Retrospective

There are a lot of very toppy patterns in the market. I thought it would be helpful to show some from the past as well to indicate what sometimes happens with these rounded tops.

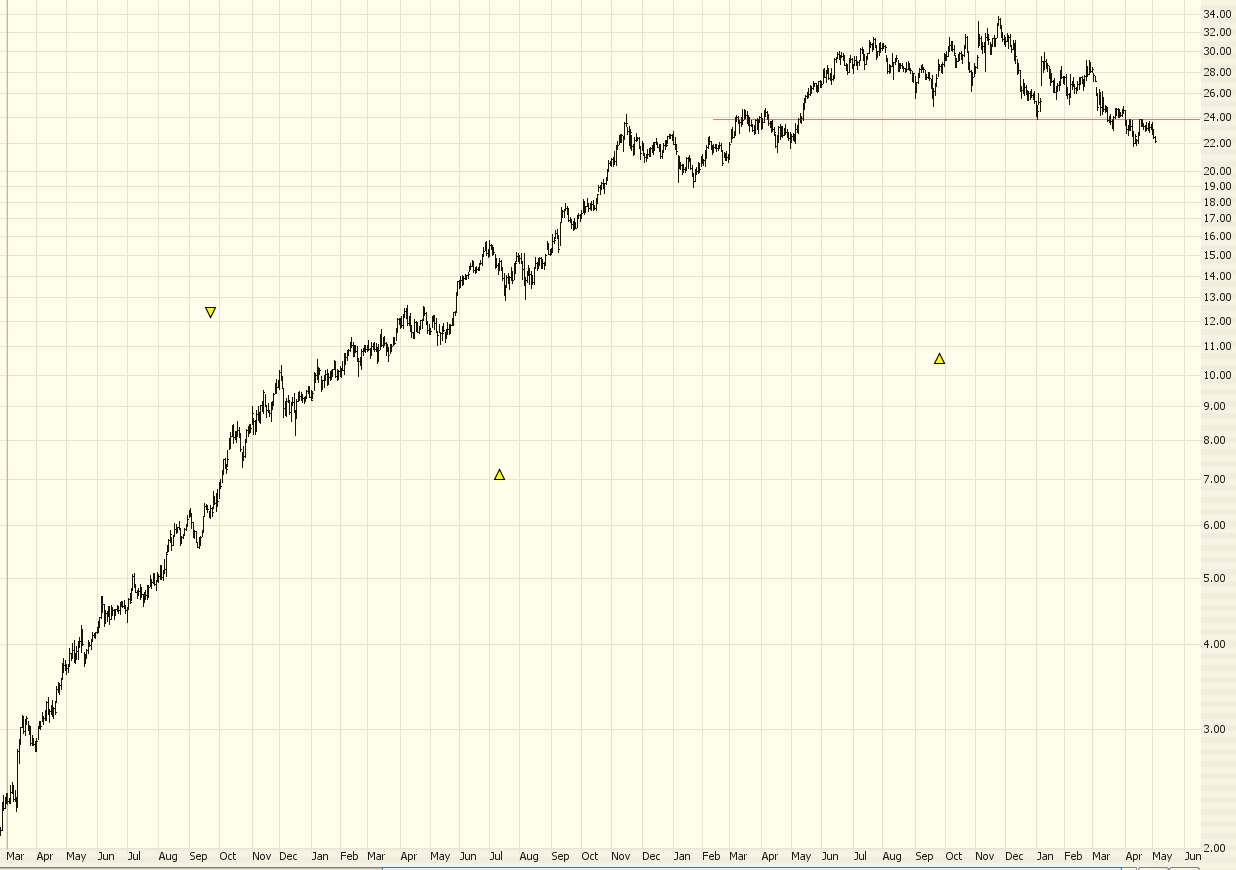
Take a look back at my suggestion late last year to short symbol FORD. At the time I marveled at how a maker of cell phone covers could be such a white-hot stock (akin to, I don't know, something like NTRI today). The graph below says it all - after a head and shoulders pattern was violated, it collapsed. It's lost about 80% of its value. (Omnipresent reminder: click the graph to see a bigger version, then click Back when done.)


One pattern topping out right now is trendy clothes seller Urban Outfitters. I don't tend to like stocks less than $50, simply because the puts don't have quite as much juice in them. But for a straight short sale, this is worth checking out (symbol is URBN).

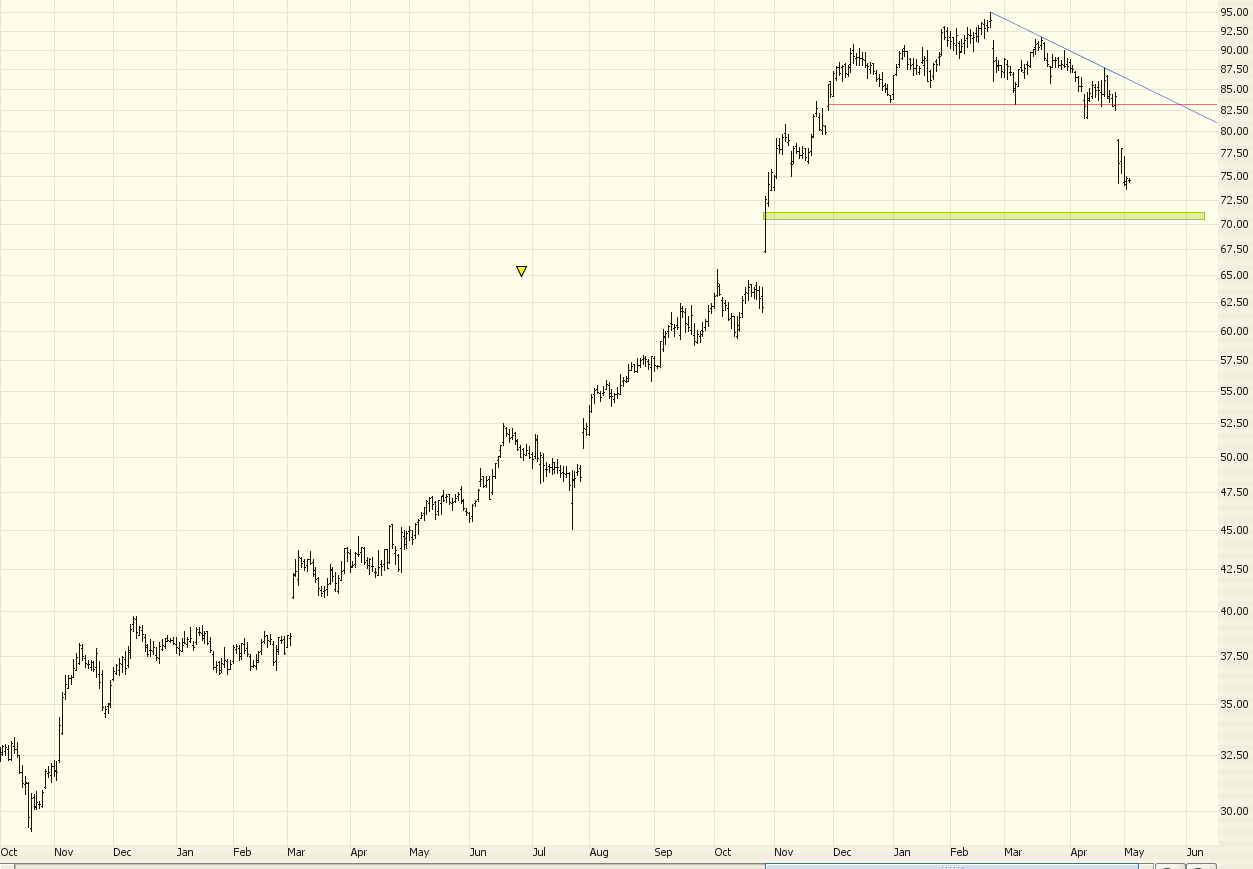
On a number of occasions I pointed to Express Scripts (ESRX) as a good short idea. It hasn't fallen as far as the shaded green target yet, but it's well on its way.

Insurance companies have been doing extremely poorly (I have not read the news to find out why). Aetna (AET) for instance got clobbered. Cigna (CI) is also taking it on the chin. I wouldn't short at these levels, but these charts are amazing.


Early last month, I suggested selling Health.net short. This is also turning out fantastic. Just look at it slice through those retracement levels!


Finally, a quick glance at our old buddy Google (GOOG). I'm offering this chart to illustrate once again how the price is clinging to those Fib levels. Even with the big rally a couple of weeks back, the Fib retracement acted like a magnet, and the price is hugging it tight once more.

Tuesday, May 02, 2006

Crude and Gold Soar Again

Once again, gold and crude oil went straight up. These markets are just amazing. I don't tend to focus on commodities in this blog, but looking at the lifetime history of gold, crude oil, and copper, I am just blown away by these charts. There are fortunes being made (and lost, on the short side) out there. This is the equivalent of the Internet Bubble in the world of copper.

The stock market remains frustrating for both bulls and bears (with the exception of those who are long oil stocks, who have been doing great for many months now). Below is the past several months of the $INDU shown on a minute-by-minute basis. As you can see, we're "due" for a downward movement, but it's been stuck the past several weeks, not really going anywhere.


There are many reasons the market "should" go down, but the market isn't going to read this blog and suddenly obey! If you look at skyrocketing oil prices, tension in Iran, a falling dollar, and the recent report that Medicare and Social Security are going to fail even earlier than the prediction of just a year ago (Medicare is just 14 years away from bankruptcy, according to our government - - and I'm sure that'll get closer), one would think we'd be seeing prices in a tailspin. But not so.

Here, for instance, is the percentage chance of OIH (the oil service sector ETF) recently, up more than threefold:


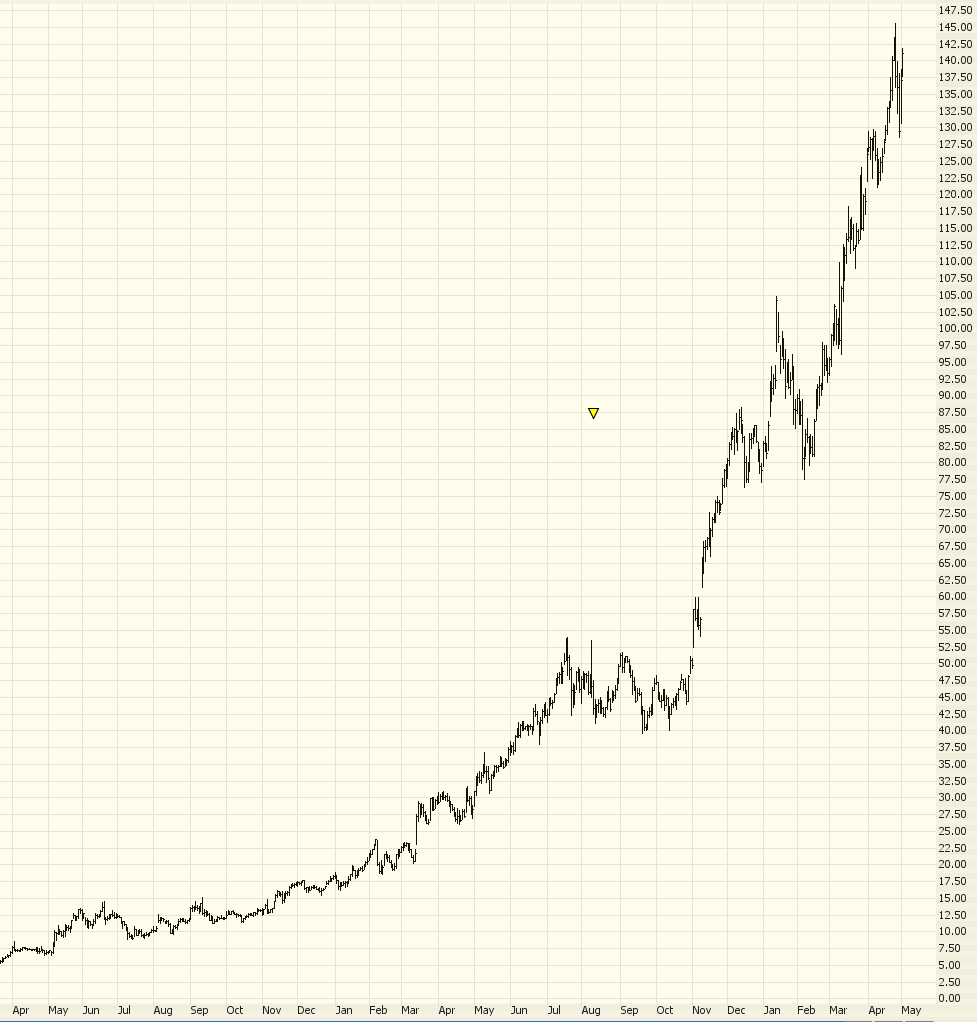
One stock in particular (which even I'm not fool enough to touch anymore) is Hansen Natural, HANS. I'm not sure what they're putting in these soda cans (crack perhaps?) but it must be addictive stuff, given these valuations. I've put this graph in arithmetic form to illustrate just how amazing the price rise has been. It's got to fall someday, but I don't go near this thing - - it's a monster!


One recent recommendation that seems to be working out is Genentech. The head & shoulders pattern is complete, and it lost a couple of points today. This chart looks better than ever for a fall:


Long-time reader PB commented in last night's posting, "what is the point in being bearish in this market if all it does is go up on seemingly bad news??? It'd be a lot less painful just to go long!"

I'm afraid you are correct.....it seems the least painful thing to have done over recent history is just to pile on to the markets that seem insane (gold, copper, oil) because they just get more insane. The trick, of course, is knowing when to get off. For myself, I just don't want to do it - - the risk seems far too high in these hyperbolic markets.

Monday, May 01, 2006

The Wimpy Bull

Well, how's this for a contrarian indicator? The esteemed newspaper Barron's had this on their front cover:


Complacency is now complete in the public's mind! (I guess the grumpy bear in the lower right are readers of this blog!)

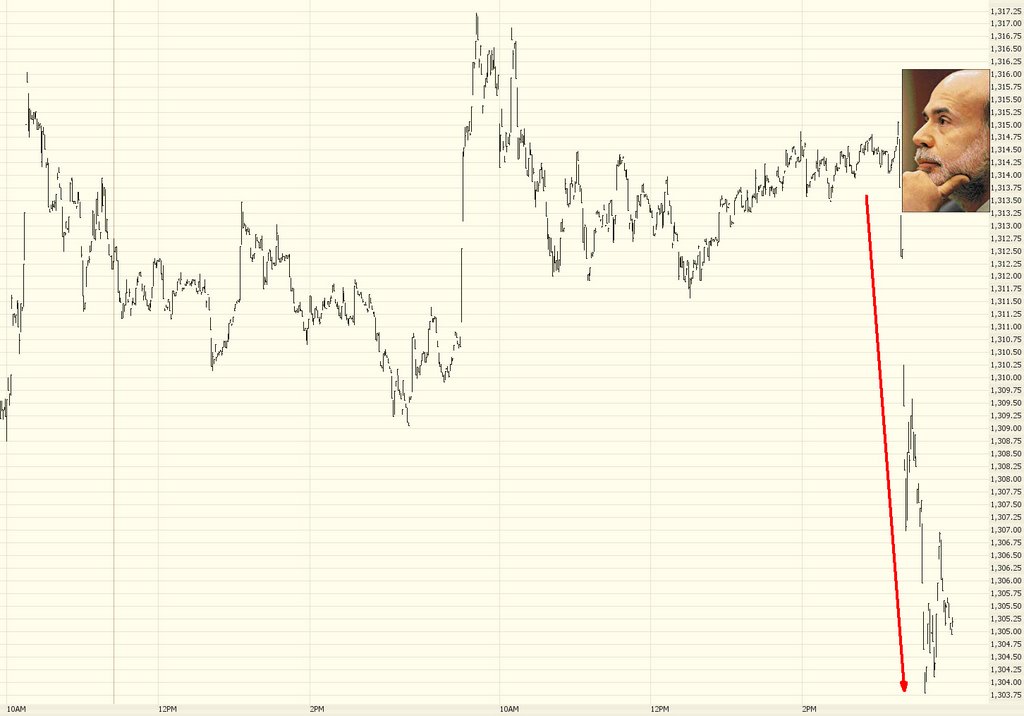
Anyway, for most of the day, the bulls were in charge, especially in the land of oil, commodities, and gold. Copper and gold have just gone bananas. Anyway, the Dow had a nice healthy 40 point gain for virtually the whole day, until big-eyed Maria B. mentioned Ben Bernanke felt the public had misinterpreted him as an interest rate dove.

The mere second-hand mention by a reporter of the chairman's finessing of his statement caused the market to unravel in a matter of minutes.


Is this really the snorting bull that's going to push the Dow past 12,000? This is a weak-willed, lily-livered bull. Any little risk, and it runs for the hills. Added to which, oil and gold are so stratospheric, when those eventually decide to come back to earth, it's going to be another big negative pull on stocks.

By the way, here are my current positions on which I am long puts:

$SPX
AHC
APC
ATI
AVB
BHI
CLF
CMI
CRS
ENER
EXPD
FLR
IPS
IWM
IYR
JOYG
KMI
NTRI
NUE
OIOH
PD
UBB
X

I don't do much FOREX in this blog, but I wanted to mention that EUR/USD looks like a good short. I'd put a stop in at $1.2931 on this one.