Monday, June 20, 2005

Broken to the Upside


Every chart tells a different story. The index charts these days are no different. You could look at $INDU, $SPX, $COMPQ, $NDX, $OEX, $UTIL, $TRAN, $RUT, $MID, etc. and discuss each of them differently. But let's focus on the Russell 2000, the $RUT (whose ETF equivalent is the IWM), since I've been writing about it most recently.

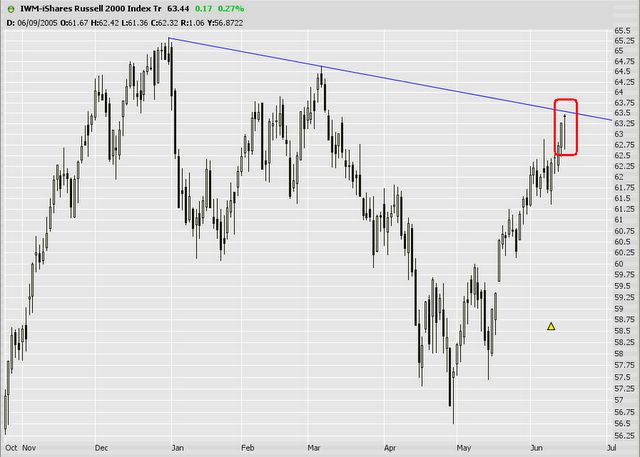
I pointed out last Wednesday, June 15th, that the IWM had finished the day in an extraordinary candlestick formation which was very bearish. Thursday's action negated that candlestick. The market opened higher, push through the descending trendline, weakening the case for the bears (like yours truly). To worsen matters, the next day IWM reached a high above its March 7th high, thereby negating a notion of a market reaching "lower highs" (in other words, a stair-step down pattern). It only got a penny above the March 7th high, but all the same, it pierced that former level. This does not make for the kind of market swoon a bear would want to see.

But the market isn't out to please either the bulls or the bears. It just does what it does. It is in a never-ending process of price discovery. It's up to us to try to anticipate what price it's going to discover next!

Today, Monday June 20th, the market did fall, but it did not fall beneath the trendline which was broken last week. This could be a set-up for further strength. Remember how trendlines switch the "support" and "resistance" coat. The descending trendline, formerly resistance, may now be support. IWM would have to fall beneath this trendline to negate this bullish set-up (and if it did, we might as well erase the trendline, because it's being hopped across so many times as to render it pointless).

Oh, one last thing before I close - check out ADEX. It's one of the few good looking bullish charts out there. A relatively conservative stop price on this issue would be $26.20.

Wednesday, June 15, 2005

Now THAT is a Candle!


First, since I haven't mentioned it, you should note that clicking on any of these images will make a nice big version of the image show up. Because I realize these charts are pretty small.

Anyway, the market continues gyrating up and down, with a bias toward 'up.' Some of the indices - like the S&P 400 - are nearly 30% higher than they were at the highest point of the 2000 bubble. So in some cases the market has out-bubbled the bubble.

The 'candle' I am talking about appears in a number of major indexes, but the example I am showing above is symbol IWM, which is the ETF for the Russell 2000. There are three really strong reasons to indicate that this is a top.

ONE, the inverted head & shoulders pattern spanning from mid April '05 to mid May '05 had a target upside of 63.50. That upside was met almost to the penny today.

TWO, the prices are coming up against a descending trendline that spans back for months.

THREE, I have rarely seen a candle pattern quite so clearly. In fact, this is an almost perfect Dragonfly Doji pattern, which is considered quite bearish.

If IWM gets above 63.50 tomorrow and the market is generally bullish, it's going to make this argument fall apart. Indeed, the market has been in the throes of this tight trading range since May 19th, and it has got to break at some point. Either direction, it's going to be a strong move.

Tuesday, June 07, 2005

Sputtering Out of Gas


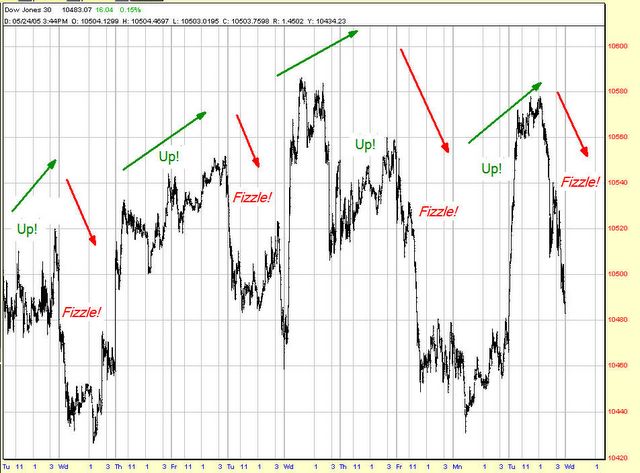
The chart above is the past ten days (on an intraday basis) of the Dow Jones Industrial Average. As you can see, the trend is that there is no trend. Up. Down. Up. Down. And so forth.

Today was a perfect example. The markets shot higher, stalled, and fell right back down to the flatline again (more or less - some lost, some tacked on a bit). But the market's ability to convincingly rally is, for the moment, simply not there.

There's a new stock I like - KYPH - with a nice saucer-in-the-making. The volume on this stock is handsome. I remain by-and-large bearish, with a particular bearishness on the $RUT (which you can trade via index options, the IWM, or options on the IWM itself).