
Now THAT is a Candle!
First, since I haven't mentioned it, you should note that clicking on any of these images will make a nice big version of the image show up. Because I realize these charts are pretty small.
Anyway, the market continues gyrating up and down, with a bias toward 'up.' Some of the indices - like the S&P 400 - are nearly 30% higher than they were at the highest point of the 2000 bubble. So in some cases the market has out-bubbled the bubble.
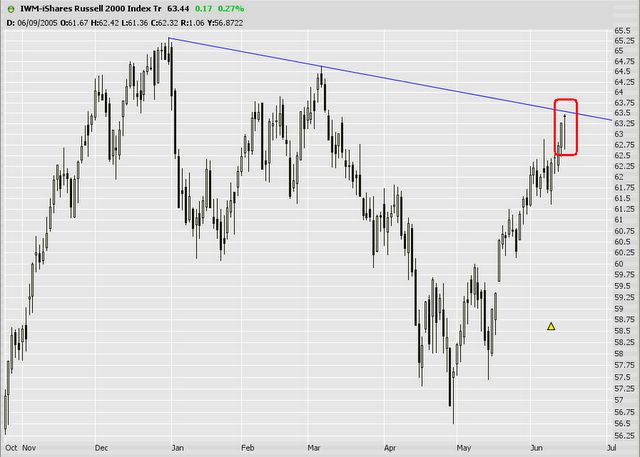
The 'candle' I am talking about appears in a number of major indexes, but the example I am showing above is symbol IWM, which is the ETF for the Russell 2000. There are three really strong reasons to indicate that this is a top.
ONE, the inverted head & shoulders pattern spanning from mid April '05 to mid May '05 had a target upside of 63.50. That upside was met almost to the penny today.
TWO, the prices are coming up against a descending trendline that spans back for months.
THREE, I have rarely seen a candle pattern quite so clearly. In fact, this is an almost perfect Dragonfly Doji pattern, which is considered quite bearish.
If IWM gets above 63.50 tomorrow and the market is generally bullish, it's going to make this argument fall apart. Indeed, the market has been in the throes of this tight trading range since May 19th, and it has got to break at some point. Either direction, it's going to be a strong move.
No comments:
Post a Comment