End of a Terrific Week
I never thought I'd declare a week in which we had a +212 up day on the Dow to be "terrific", but it has been. In spite of the (idiotic) one-day rally based on Bernanke picking his nose, or whatever he did to get the bulls excited, I had my single best percentage gain of all time on Thursday, and overall the week was really profitable for me. I think that speaks to the overall deterioration of the market. If a bear can make a bunch of money in a week that sported such a huge rally (and don't forget the +51 up day on the Dow on Tuesday), something's going right.
I have almost 100 - yes, one hundred - short and put positions right now. Not one stinking long in the bunch. And I think all but one or two are showing a profit. I'm not going to assail you with more stock charts. Indeed, my "pictograph" posting seemed to get a lot more comments and attention than my huge slew of charts. So I'm going to refocus on the market in general this time.
Oh, by the way, I just got a sneak peek at what the cover of my forthcoming book is going to look like. Ya'll are all going to be required to buy this once it's out, ya know!
The first chart is of the Dow Composite (symbol $COMP - and, gotta say it, click on an image to see a much bigger version). This one is fascinating because the reference line for the Fibonacci Fans drawn here - - ummm, I just realized how boring this description would be. Suffice it to say these are not trendlines, and I'm kind of blown away at how accurate these fan lines turned out to be, considering the reference line is nowhere near them. The price is definitely playing with the idea of cutting underneath that highest fan line.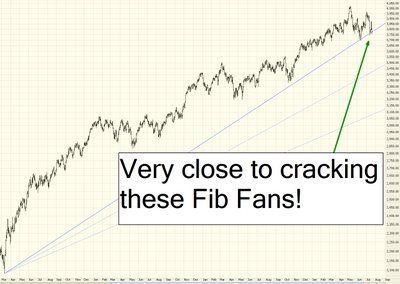
Next is the Dow 30, and I know you've seen this chart a million times. But we have got to cut underneath 10,660. That huge green shaded area represents the last, best hope of the bulls to keep this market floating. If we can get the Dow beneath that level, we're gonna own 'em.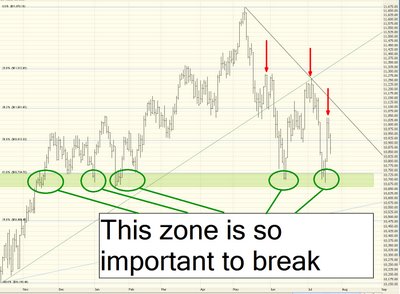
The S&P 500 is in the lower half of its ascending channel, and it's look very interested in pushing beneath recent lows. If it breaks under that ascending support line, things are going to get really exciting. We are still within this channel, however.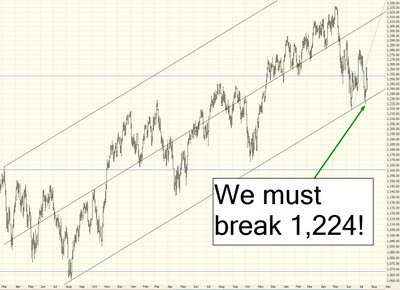
The Transports actually look like they could take a rest for a bit. They are approaching both a pretty substantial trendline as well as a Fib retracement level. So it wouldn't surprise me to see the Transports bounce a bit soon here.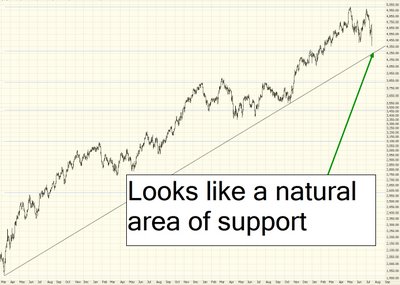
And, finally, a recent favorite $XAU (Gold & Silver index). This is similar to the Oil Service Sector (beaten to death this week, so I shan't be showing that chart again), except that the head and shoulder is still in formation. (As for OIH, it sneaked beneath its neckline today). This looks like a honey.
I promised this week would be exciting, and it was. Next week is bound to be the same. And just remember, we're moving closer all the time to that wonderfully bearish month of September! Oh, by the way, if the Dow does break under that green area, I'd say we're headed for about 9,800. Should be a fun ride.

22 comments:
Tim, you are the man! i am still oiling my shorts! Keep those charts and short picks coming! I've never had so much fun watching the market go down! Goodluck all! Chronictown
Hey Tim, thanks for the great update. Can you tell us more about your book? I will definitely put it on my wishlist.
i will buy the book when it comes out.
Tim, congratulations on the book. I must have misssed out on prior posts about it. When will it reach the shelves?
-Jon
can i get a signed copy ?
Jock, Tim really is a machine, if you hadn't figured that out by now. ;)
Tim, put me down for a signed copy!
Tim!
Stop the presses! You better not allow your book to hit the streets because it will turn around those bearish stocks like Amazon which will probably double their profits off your forthcoming work! You'll make more money off the puts than you could possibly make as an author. As an alternative, I would recommend that you release it as an e-book and sell it directly on your own web site. That way you won't feed the Bulls profits. The shortfall would be that only us dedicated traders will read your wisdom and reap the benefits! (Did I miss any exclamation points?)
So when is the release date? What's the cover price? I didn't find you listed on Amazon unless your middle name is Orr and you wrote some books on robotics and computer programming in a past life...
Prosperous Trading!
Chris
Tim,
Technical Analysis of The Financial Markets and Intermarket Technical Analysis by John Murphy are the standards..
Will your book simply be a copy of these 2 greats. We'll see!
Here's the deal..$120 crude,the Dollar Index below 75 and Gold above $850 and there is nothing we can do about it..it's a done deal by the 1st Qtr. of '07.
Thanks in part to the U.S. backing of Israel's move into Lebanon (Headfake..we want Iran and the IOB)also Helicopter Ben hiding the M3 money supply figures.
Was that petro"euros" or petro"dollars". I forget... must have something to do with the electric shock treatments??Sig Heil!!
The Rothschilds,Buffet,Gates & Soros make the world go round or should I say...make the "New World Order" go round!
Oh well, so much for the conspiracy theroy ..How about what's happening on Monday 7/24 ..
As you remember from my post of Wed. 7/19.. I was short the Midcap 400( EMDU6) from an avg. up of 742.15 of which I reversed today to a long position @ 716.25 with sell stop set at 713.80.
I was in the middle of a gulp of Gatorade when she hit bottom at 714.10 and I reacted by screwing up and hitting the 1 instead of 10 so I had to go back and place another order for the 9 add on contracts..
Ok, so things don't always go as smoothly as I would like and I'm in long the Midcap 400 an entire point above where I should be.
Yes, I did ok on this trade though like an idiot I watched with tight lips as my initial drawdown approched $5k Thursday a.m. before the market turned in my favor to end today with a near 26 point gain for the week.
Review: For Monday 7/24
The Midcap 400($MID)5 min/ 1 min. which reveals an ascending triangle with 714 as the flat-top and 2 higher lows..the 714 level was hit 4 times between lunch and close today.. Oh how I love to say Quad Top.
I am currently "Long" EMDU6 @ 716.25 with a primary target of the gap @723 at($MID)or 723 plus the futures premium of 4.50 give or take on Monday.
I use the($MID)since some readers might not have access to real-time quotes on the E-Mini(EMDU6).
The S&P 500($SPX) got cradled very nicely by the 61.8% fib level(1240.29) and looks to be using this level as a launching pad for Monday though the 1238 gap was not filled today this may happen Monday.. if not..as you know it will get filled in the very near future.
The Russell 2000 ($RUT) looks set also for a little bullish action on Monday with the 5 min intraday chart showing higher lows and higher highs with a primary target being the overhead gap at 682.
The Phlx Gold & Silver Index($XAU)
smells a little overdone and may react upward Monday.. if so a move clearing 135 could send it to the 200ema per the 5 min. intraday at 138 or above. I would take a quite trip on the $XAU "Long" above 134.90 with an if filled trailing stop at 1.50 or 133.40 start looking to cover at 138 but let your stop take you out..always!!
Thanks.. I feel much better now with that off my chest.. So have a nice weeekend and all the above is off if we launch a nuke on
Saturday!
(Not) Always a Bear
Glad there is so much enthusiasm for my book - unfortunately, I'm still writing the thing! It won't be out until February or so. I'll make a stink about it once it's on the street, however. Thanks again!
"The Russell 2000 ($RUT) looks set also for a little bullish action on Monday"
i see things a tad different!!
On behalf of the silent majority THANKS for sharing your keen insight and trades. I have been following your blog for the last 2 weeks and must admit you are THE MACHINE
Tim:
This is a terrific site. I noted it in my review of Barron's (I've taken to having pen and paper in hand when I read stuff so that I can jot things down for later action. This website was mentioned--such a treasure to find.) I've been visiting for a couple of weeks, so it only seemed right and fair to provide a accolades.
I subscribe to quite a few things--free and otherwise. This site is another tool in the tool box. In April I moved predominantly to cash in all of my accounts. Purchased DIA (DEC 110) and SPY (DEC 127) puts around April 26. I watched them sickeningly lose about 50% when the market spiked in May. I sold a few for a 100% gain. Held onto ther others even though the SPY's appreciated 155% and the lowest mark. I'm still at a 92/56 gain (SPY/DIA). Your site (free) and John Murphy's ($)site at Stockcharts are two barometers that I rely on to gauge my risk in holding these positions.
I'm always impressed when experienced and knowledgeable folks provide high quality information free. I'll look forward to the release of the book. I have several charting books (pring/murphy). I'm currently plowing through some studies on behavioral finance. I think that purchasing your book will be a wonderful way to support the work that you do here as well as enhance my techinical library.
Fascinating article on what happened to the markets last two times AAII Bearish sentiment hit 58%.
If historty repeats we're in for a spectacular rally:
http://www.tradersnarrative.com/aaii-sentiment-58-bearish-522.html
Good! Bring on the rally!!
It's tough to short here unless you're willing to endure some short term pain. But if we rally, then the shorts will be MUCH, MUCH less risky.
Please, please, bulls, bring the Dow up to 11,000 and the S&P up to 1260 again.
Leisa, I'm intrigued - you mentioned a review in Barron's. When?
bring the dow back to 11150 and nasdaq 2100 and ill short awayyyyyyyyyyyyyyy
Tim: I went back to my notes. Okay, I see now how I got here (destiny!). The blogs I wrote down were jeffmatthewisnotmakingthisup.blogspot.com and knight-trader.blogspot.com. I ended up not making it to the knight-trader site and thought I had written it down wrong. In doing a search on the latter I ended up here (also ultimately ended up the knight-trader). So, it was really a serendipitous stumble. Bad memory led to good results. Sorry to give you the erroneous idea that you had a brush of Barron's fame that you did not know about! However, having said that, your site warrants their mentioning you!
Just a heads up for those who use Prophet. Don't rely on that Friday down gap in the SOX...it doesn't exist. Chart error. Prophet data has been emailed about it (2nd time in a week for SOX data, 5th time total in 2 weeks regarding that particular index chart.) Within that error, by the way, there is even a discrepancy between intraday chart (1 minute) high and daily chart high as well. That's one I see on a regular basis in other charts.
(The gap in SMH, on the other hand, is accurate.)
The SOXX could easily drop to the 340-350 area in the next 2-4 weeks, I do see it going lower however I think a bounce back to 450-500 by the end of 2006 is possible. I do see the SOXX index looking alot worse before it gets better.
Ok, I showed you my tad, now show me yours.. if you see the Russell 2000($RUT) headed further south on Monday give us a clue from wince you glean this starry eyed prediction.
This is an open forum and you are more than welcome to enlighten and bedazzle us with your "i see things a tad different'!!
Oh by the way did I forget to mention we could be looking at petro"rubles" as per Mr. Putin on 7/01/06 and so don't waste your time shining that hoard of American Eagle Dollars cause the shine has long ago faded and the blood of youthful G.I's will continue to flow as surely as we want the oil to continue to flow.
How about those oil-shale research grants given out by President Bush for development of an efficient extraction process when can we count on those paying off??
An energy(oil)driven global economy with the greenback as the trusted reserve currency must be protected at all cost..cause your nearly $9 trillion national debt hangs in the balance..or is that out of balance..you decide??
Sorry, was that some pent-up bullish blow off there or what!!
Hey,I just pull up into your driveway and blow the horn..I don't get out and come to the door to met your parents.
If that ride on the $XAU sounds interesting just look at the chart and buy your ticket(call options)for what will be a a fast paced journey. Only problem those babies are very expensive so buy deep-in- the-money as your delta will approch parity.
(Not)Always a Bear
Tim: Thought I'd chime in with kudos too. I'm relatively new to the blog, but your insights are fantastic.
A while back you posted a list of your positions. Any interest in sharing an updated list?
Ticker Sense on what earnings imply about the bull market:
Second, the percentages seem to be an indicator worth following. In 2000, there was a large drop in the number of companies beating estimates, and we all know what happened to the market then. Also, early 2002 saw a large pickup in positive surprises; a number that preceded the market bottom later that year.
Finally, current levels would not indicate that trouble is ahead. Companies are continuing to beat estimates at the same pace that they have throughout this bull market. Even now, since earnings season began with Alcoa on July 10th, the percentage is at 73 (not shown on chart) - matching the high seen in early 2004.
http://tickersense.typepad.com/ticker_sense/
Post a Comment