Wanted: Clear Direction. Please!
The Dow was down 34 points today. Big deal. This market is so boring these days. There's just no direction. A little tug up. A little tug down. Intraday graphs are like spasms. The S&P 500 is basically exactly where it was when 2006 began. It went up a while. Then it went down a while. And now it's up a little. Zzzzzzzzzzzz........
Oh, before I forget, this blog is now part of the Ticker Sense poll. Thanks, guys! Is there a way to auto-click the Bearish radio button?
If you have the time and the interest, here's a fascinating (and long) article about large economic trends, particularly centered around debt and interest rates. Bottom line is that a recession is virtually a foregone conclusion.
Oh, one other thing. By happenstance, I found this KlipFolio product. Download it - it's free! And you can add your favorite blog (ahem) to it.
I have two standards for judging new software: does it work right/feel right immediately out of the box (the answer for Klip: yes!) And am I still using it in a couple of weeks? (We shall see!) I've sometimes become jazzed about stuff that I never touch again. Which means, to me, it's not useful. Klip seems awfully cool, though.
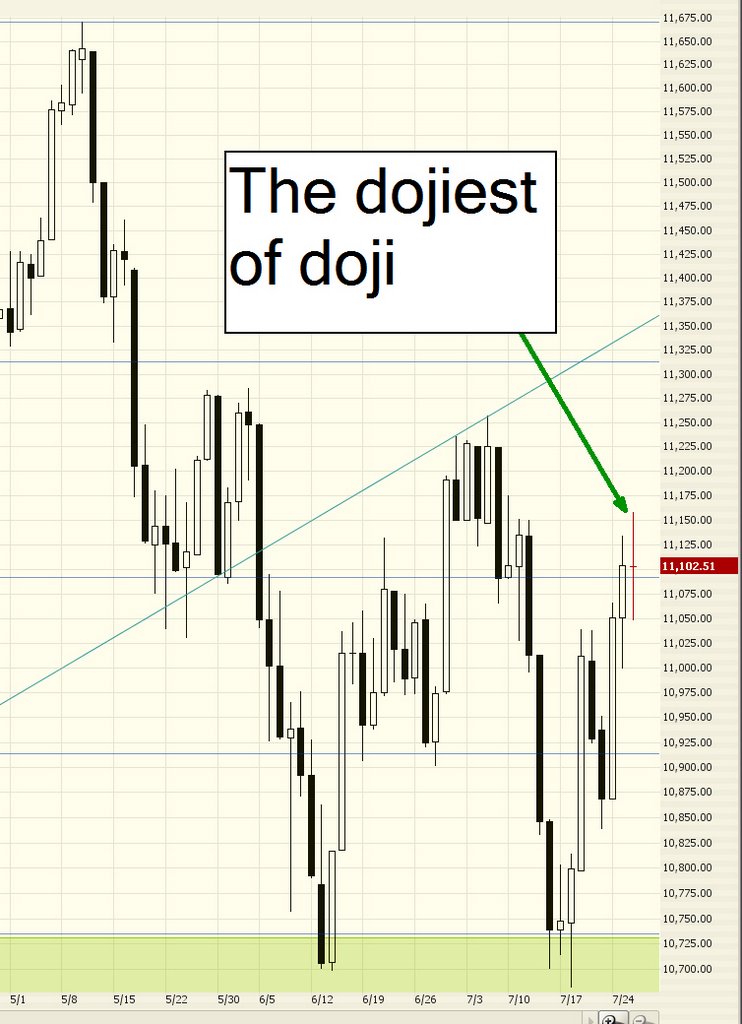
OK, on to charts. And there's a bunch of 'em today. Because I've got to believe the market will eventually snap out of this boring funk. And, if there's a God (or at least a sensible God), the market will fall big-time. So let's be prepared, Scouts.
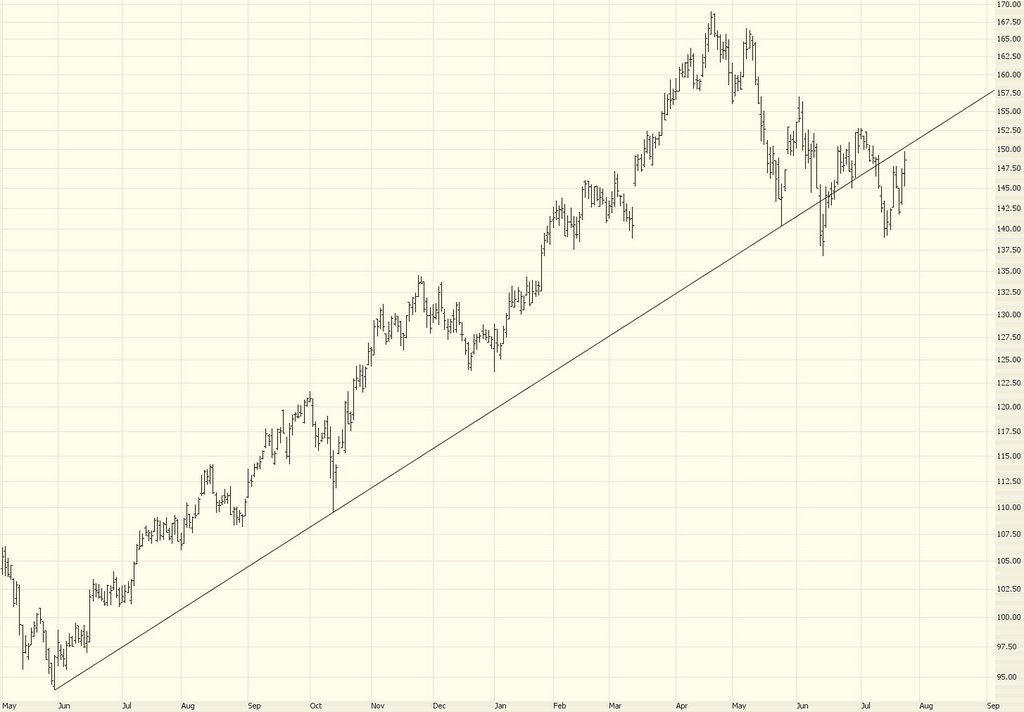
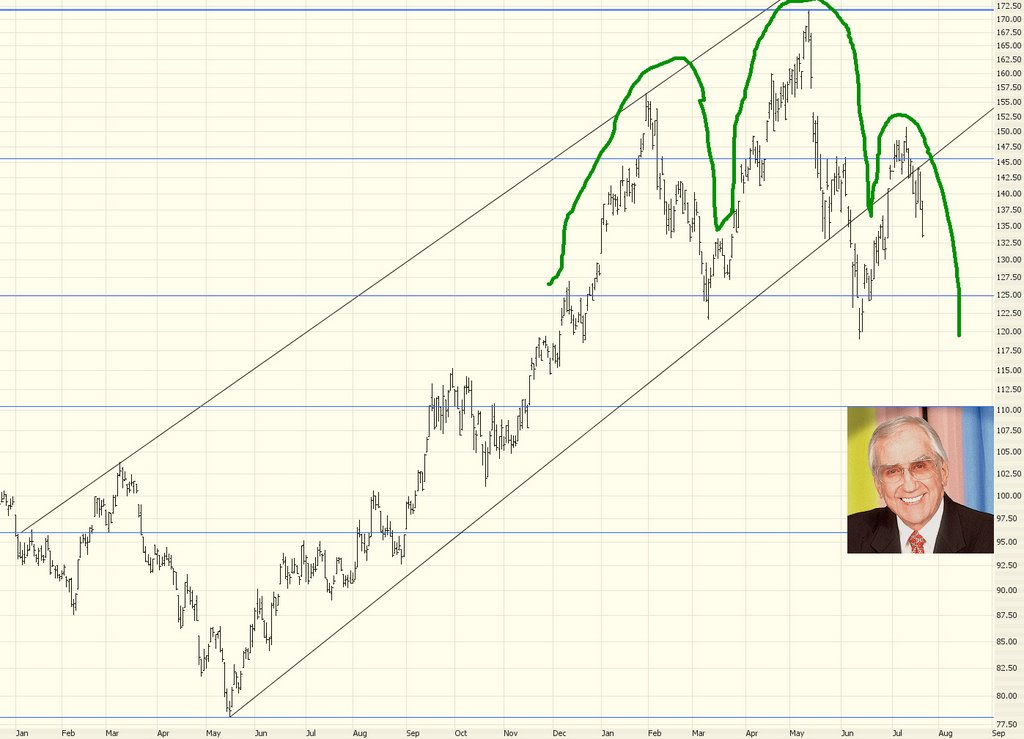
HANS has been fascinating to me for a long time. It has bagged a nearly 10,000% gain over the past couple of years, and I think everyone on the planet is waiting for it to snap at some point. Here's the astonishing graph. Some people have become very, very rich on this stock: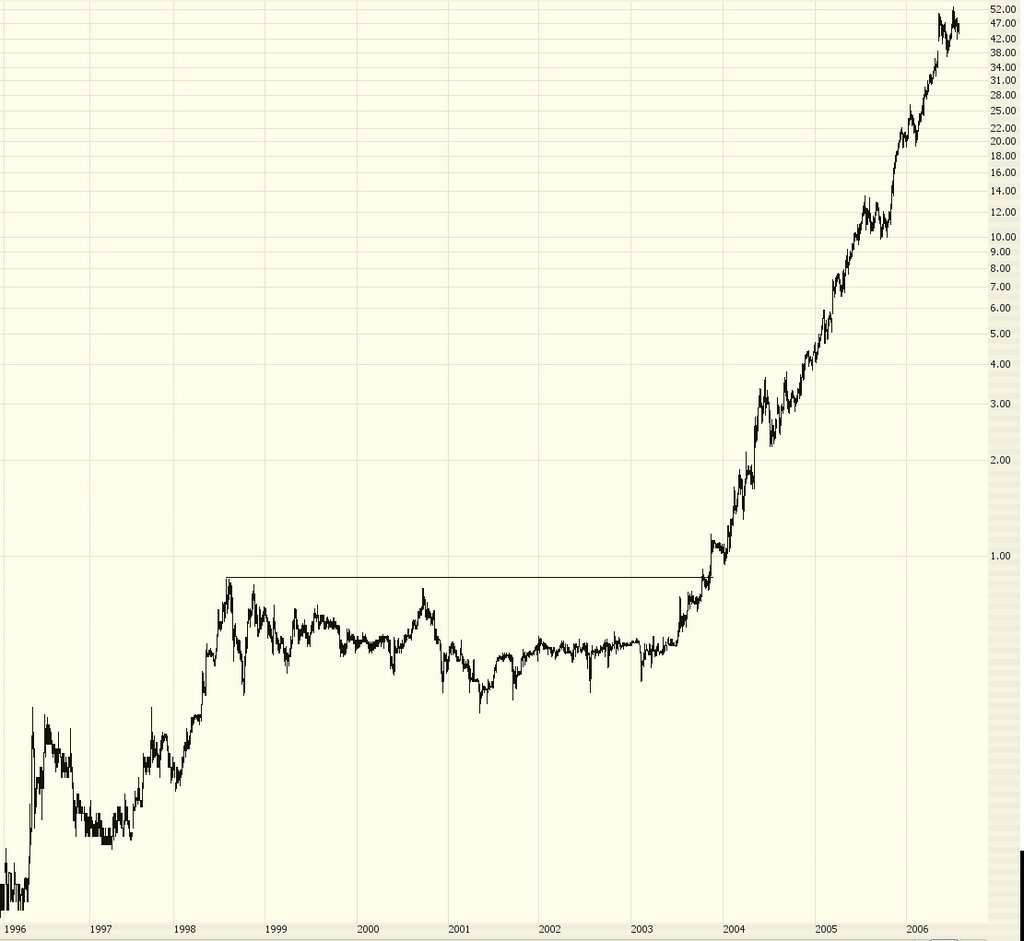
Let's take a closer look. This graph is more recent, and it features two moving averages on the price graph as well as a moving average on the volume graph. Notice a few things. First, volume is really starting to soften on this stock. Second, the 50 day moving average hasn't crossed below the 100 day moving average in a very long time. I'd take this as a strong sell signal if it does. To be honest, I'm short the stock already. I guess I (foolishly) want to get in early on what I hope will happen.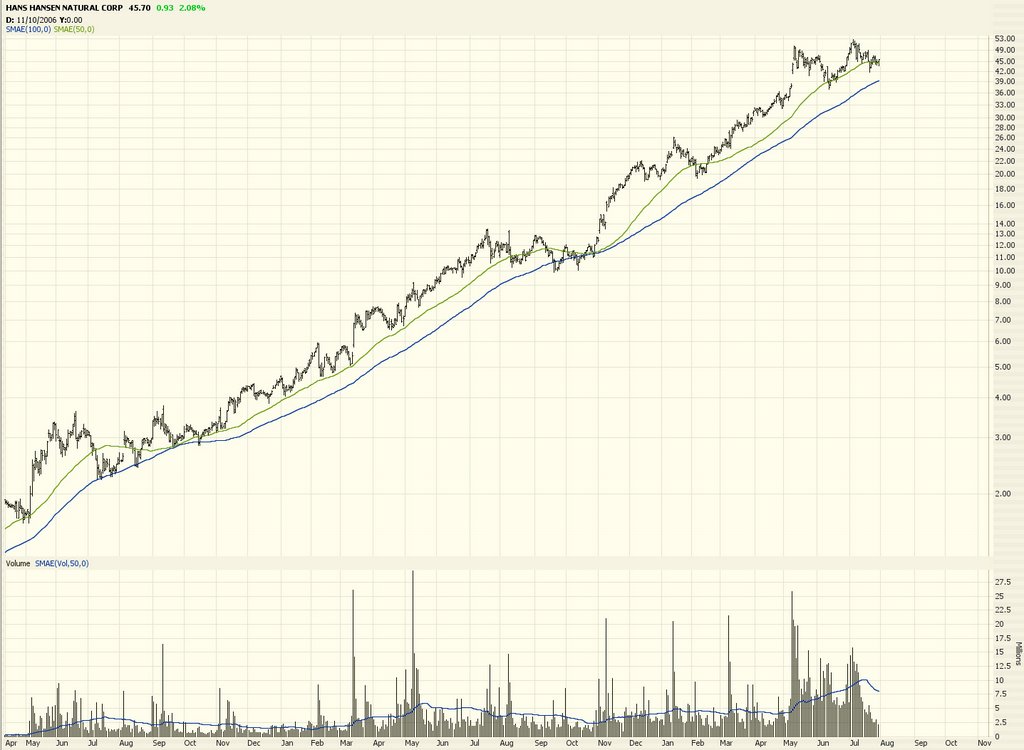
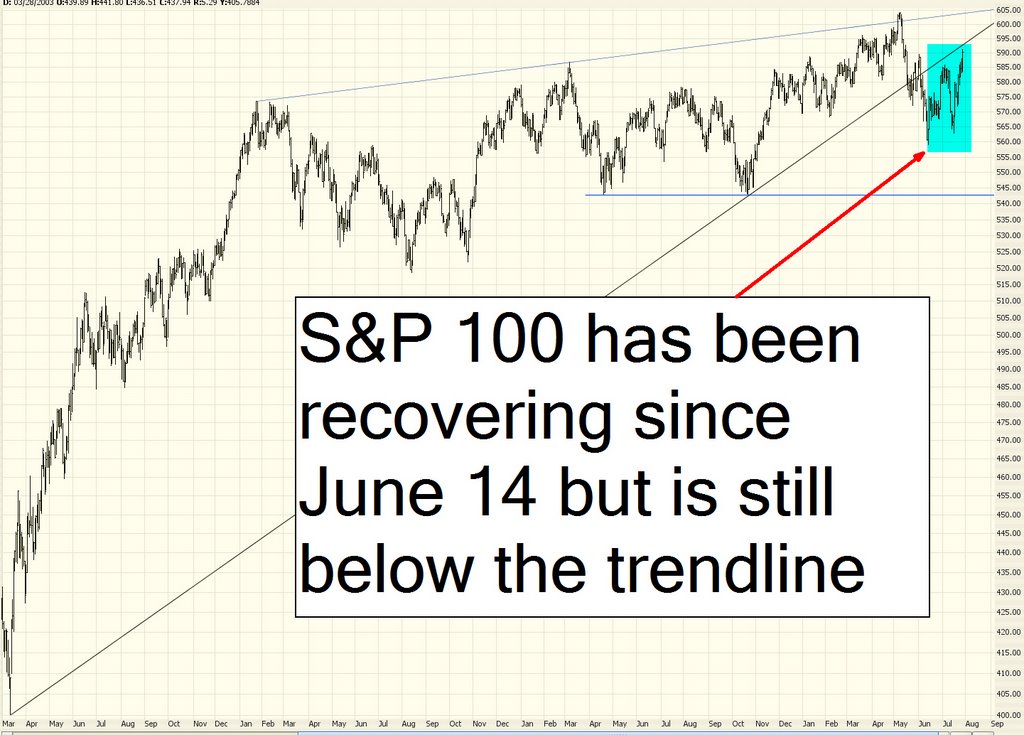
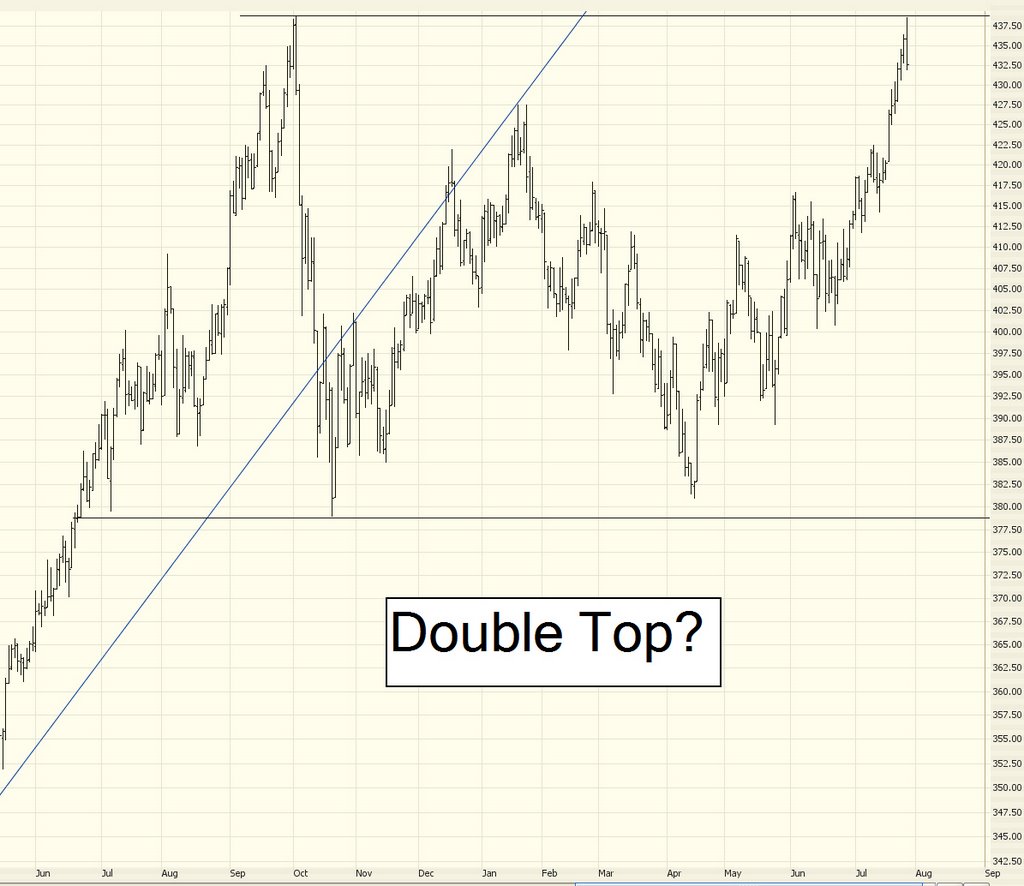
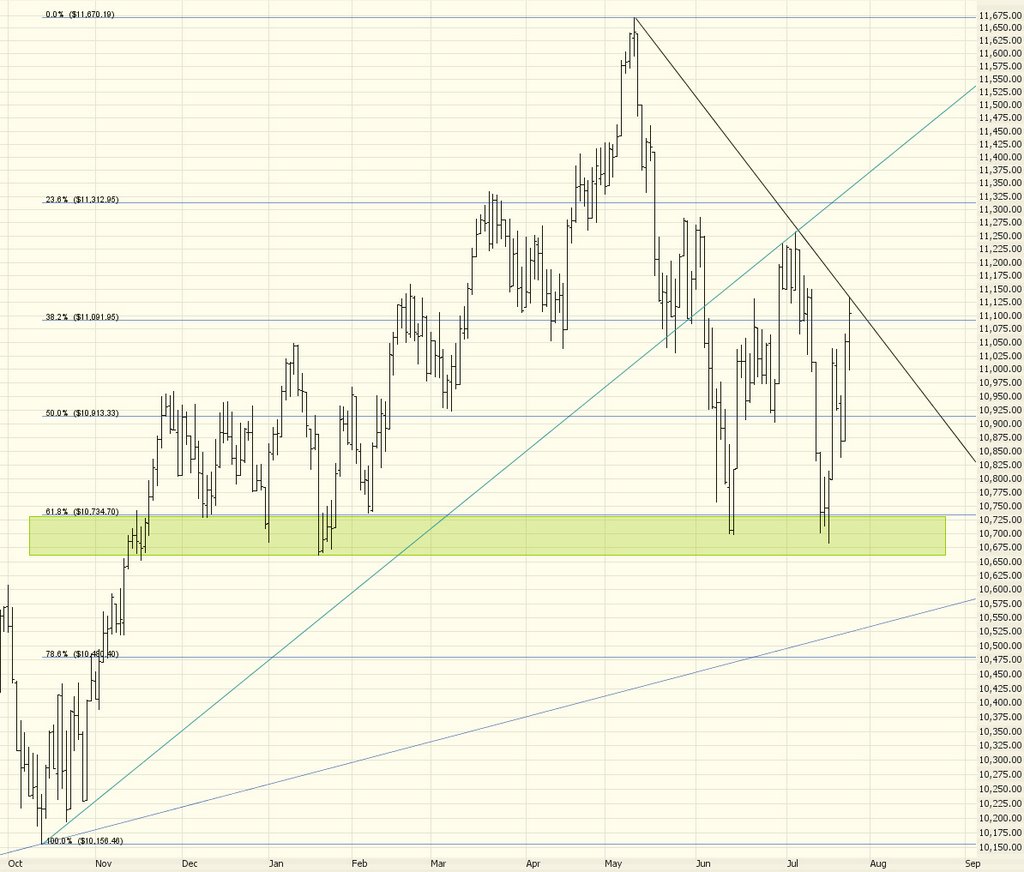
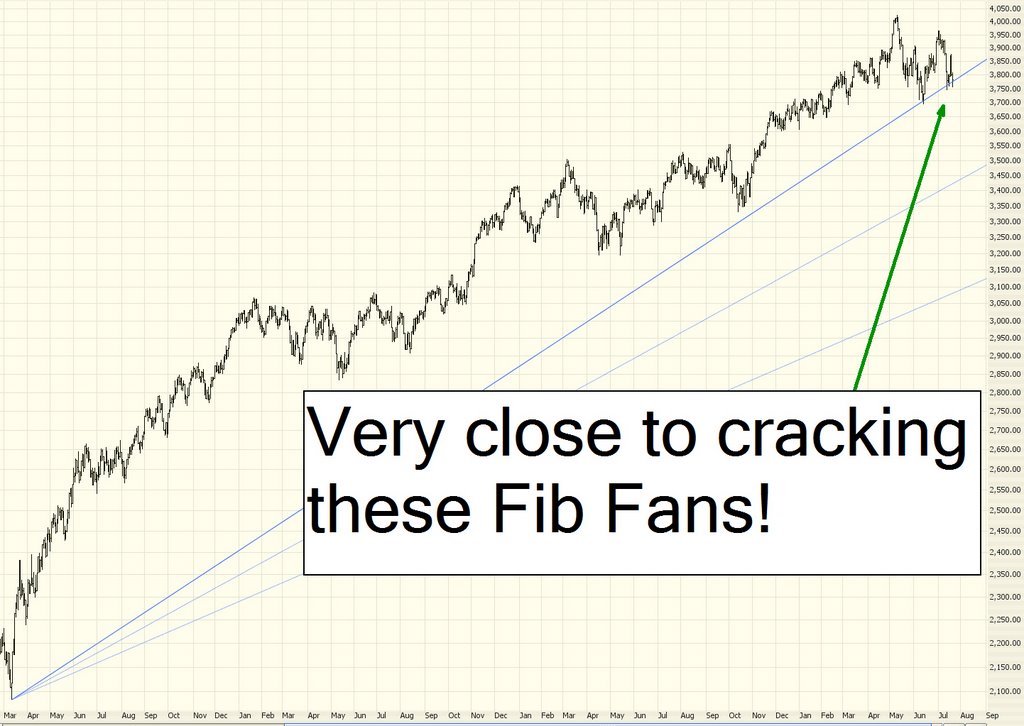
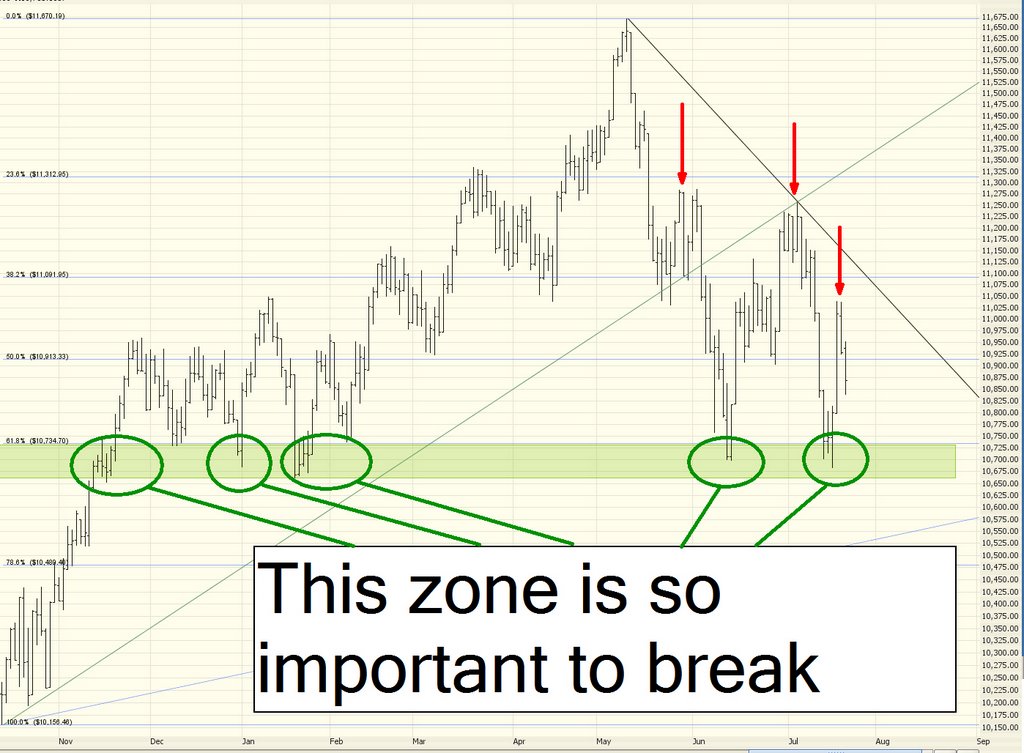
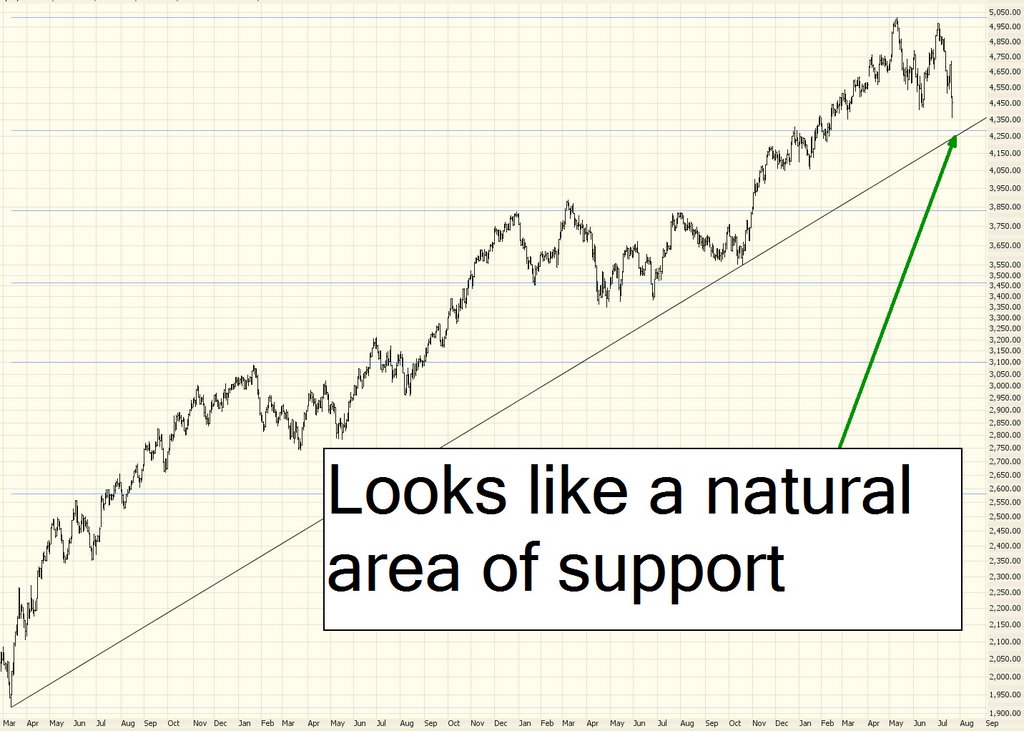
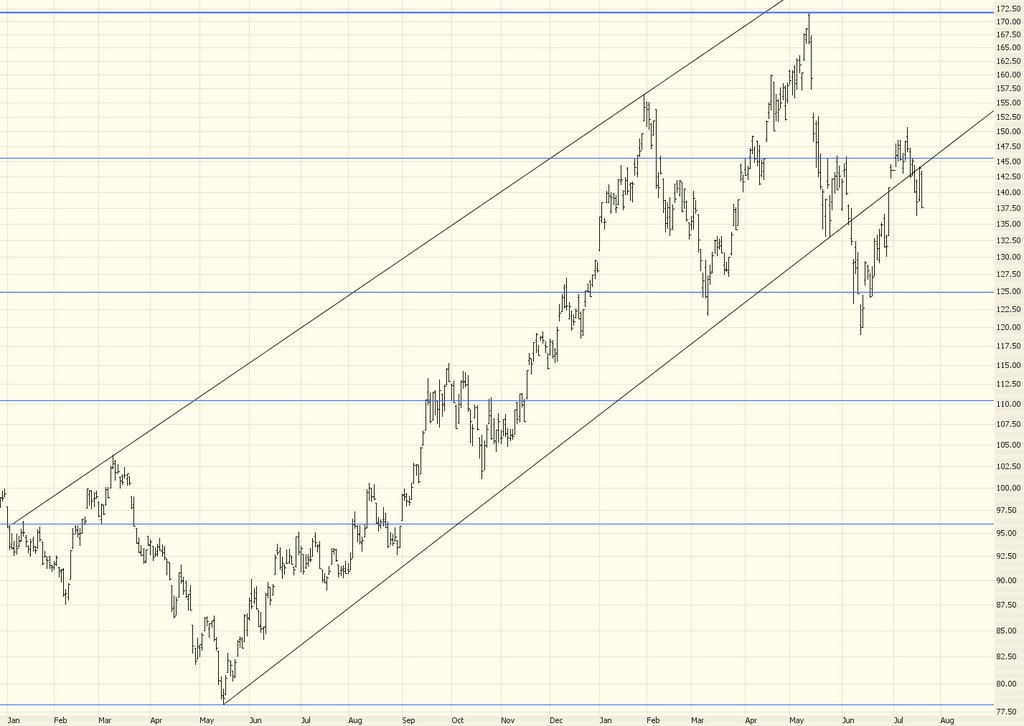
I want to put the S&P graph up again simply because it's so beautiful. You can see all the drawn objects I've laid down on this graph. It would take an amazing amount of bull power (you can think of a more colorful term) to turn this market decisively upward. But it's happened before. The jury is still out right now. There are many strong forces at work that could rip the guts out of this market.
From here on out are graphs with stop prices. Simple. I think all of the following charts are optionable, so you might want to pick up puts. The stop price I cite is the price above which the position should be closed. First up: AMG 95.05
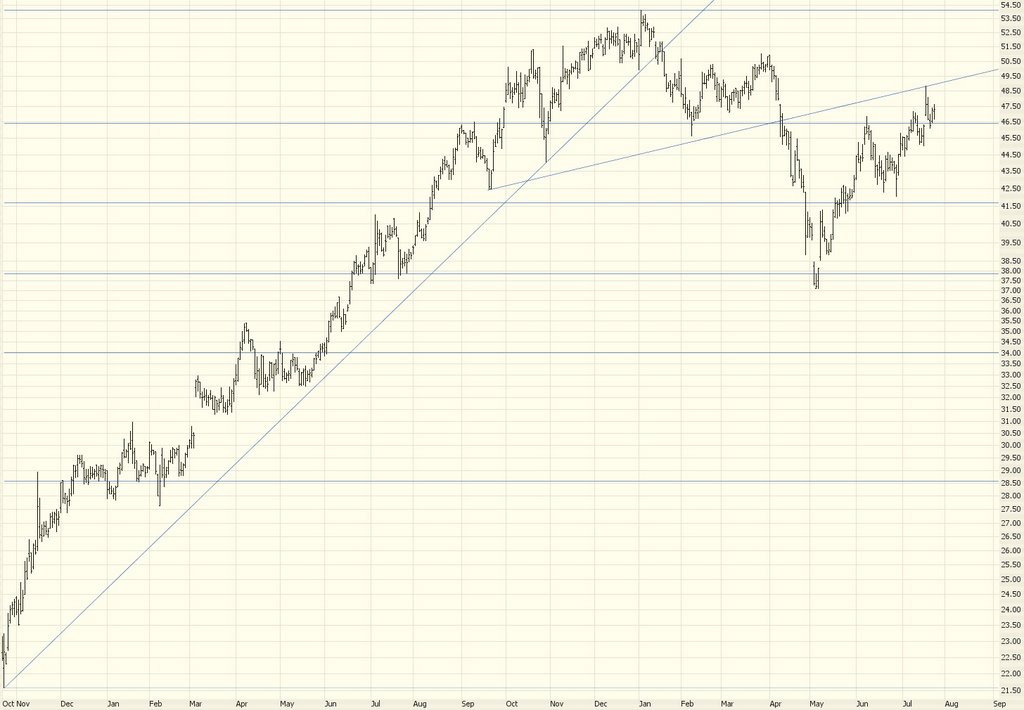
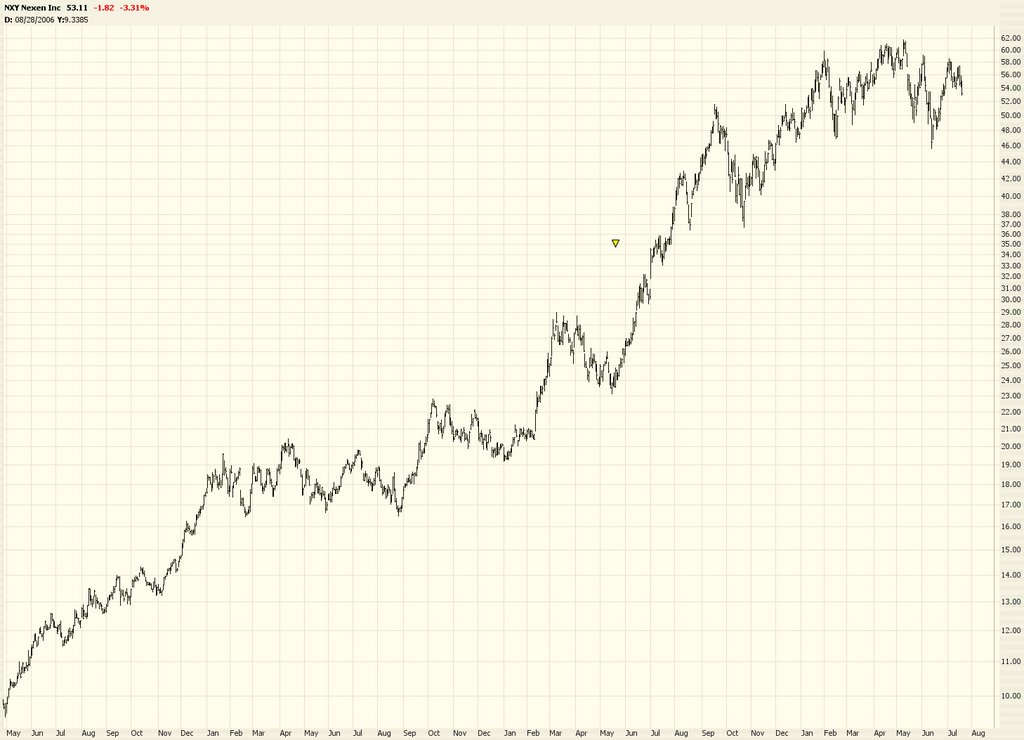
ATW 50.64
DIA 112.56
HUM 58.26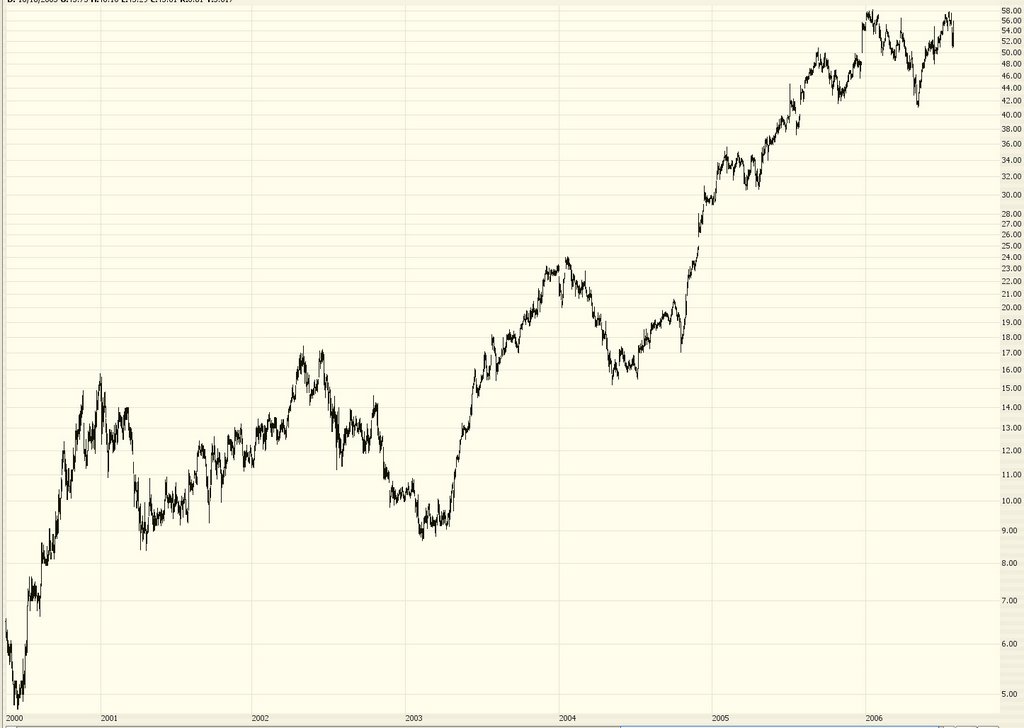
IYR 75.02
MER 73.50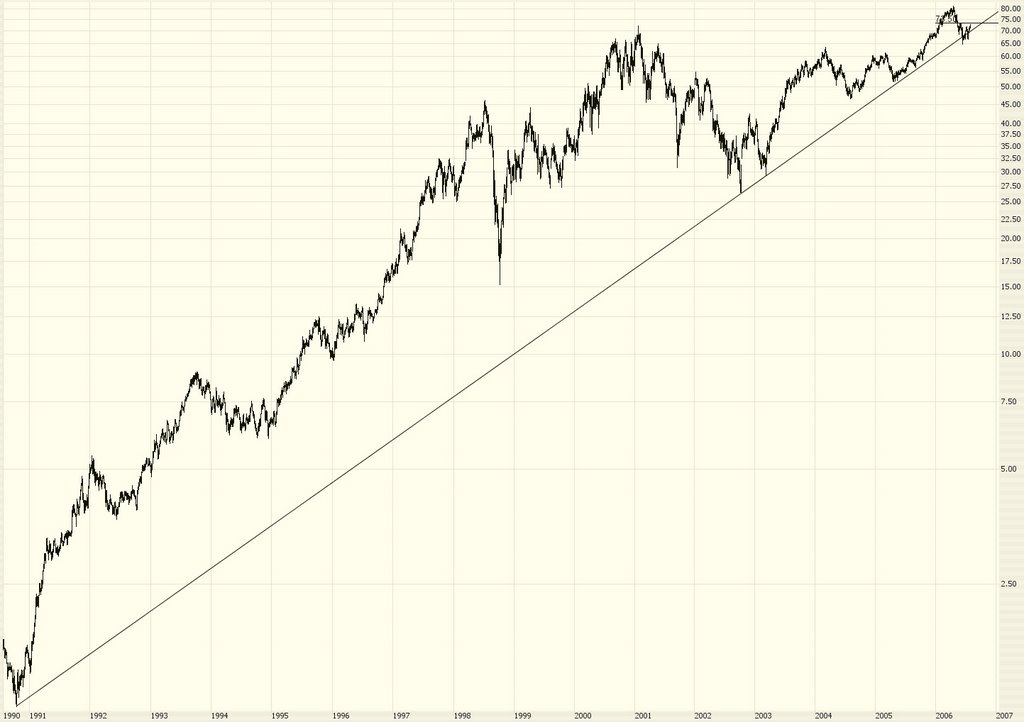
MO 81
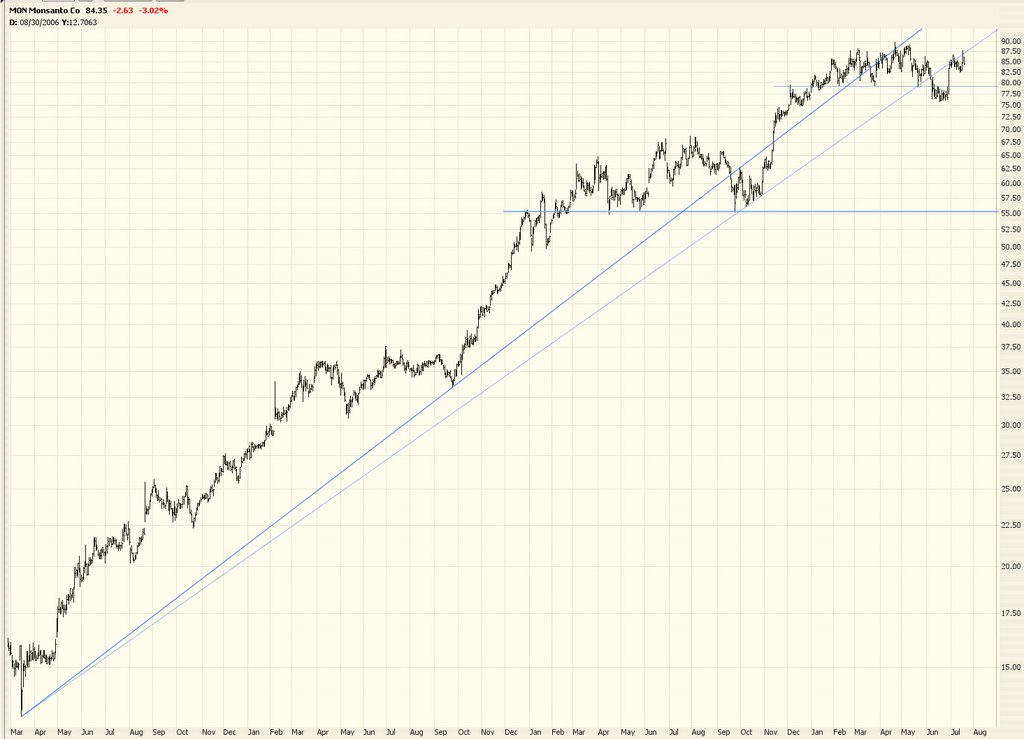
MON 43.86
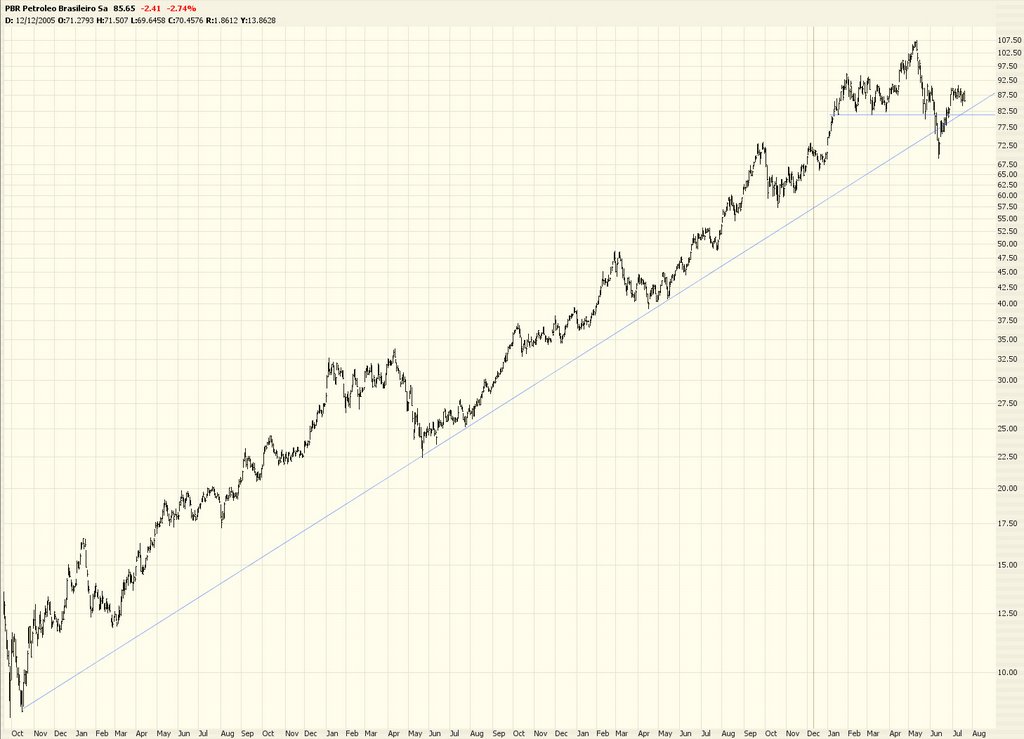
OIH 152
Good luck! And, remember boys and girls, if you want to see a bigger graph, just click on any of the small images. Click Back to return to this blog. See ya....