
A Bad End to a Great Day
Until about 2:45 EST today, this was looking like a fantastic, bears-are-back-in-charge kind of day. The Dow was down about 130. Every attempt to push the market higher was met with bears pushing it past the prior lows of the day. The direction of the market was everything we've been waiting for.
Unfortunately, the bulls have staggering firepower and confidence, and they wiped out all but 28 points of the Dow's lose in a little over an hour, tacking on 100 points to the Dow from its lows of the day. Very discouraging and disappointing. But let's at least take solace in the fact that the market was down for both the day and the week. Down is down, people. Let's not get too self-pitying.
Here you can see the areas I've highlighted, indicating the places where the bulls have slashed back at the bears by bidding up stocks.
I do get a sense, though, that the bulls' merciless grip on the market is starting to slip. There was no more succession of daily lifetime highs. For the moment, at least, the atmosphere in the market seems to have changed for the better. But one thing is certain: if we don't break below 1,375 on the S&P soon, this brief sense of bearish confidence is going to fade. We must break this level, period.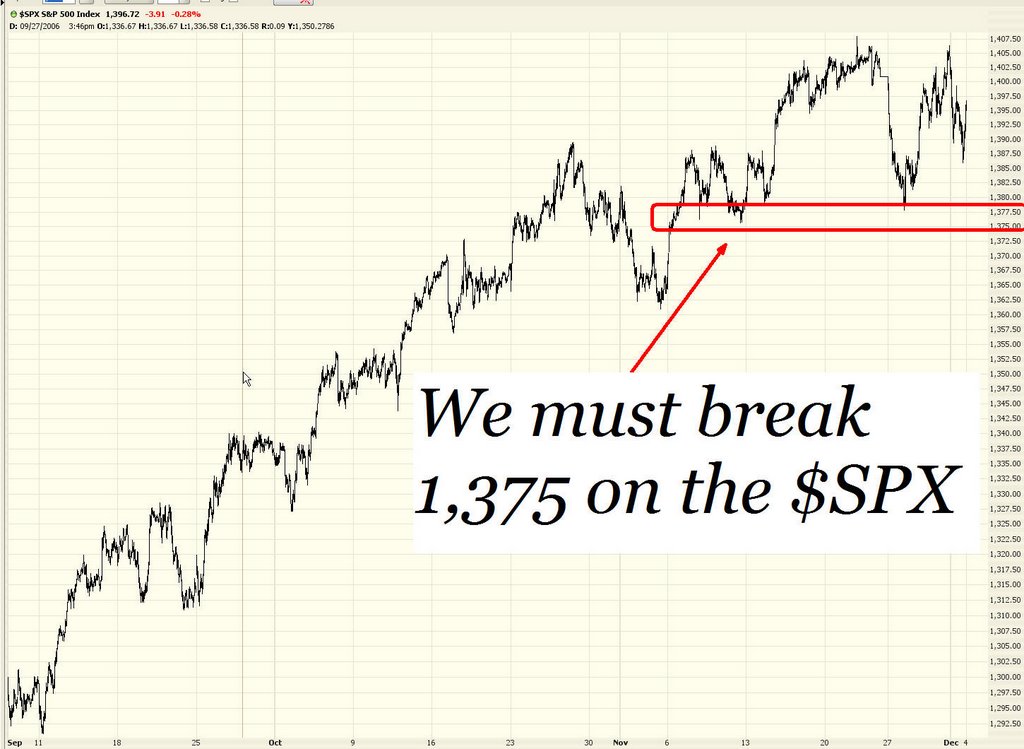
I've got just a handful of short suggestions today. GOOG is one I'm hesitant to put forward, but I feel compelled to do so. I don't have a strong technical reason for doing so (except insofar as the recent breakout really isn't going anywhere). I rely more on the notion that whatever everyone knows is not worth knowing. And what everyone knows is that GOOG is the king of the world, it can do no wrong, it's a cash machine, and it has stomped everyone else out of existence. Well, where do you go from there? When anything is priced for perfection, it seems an ideal time to fade the market.
A less dramatic suggestion is HES, which I think has recovered about as far as it's going to go.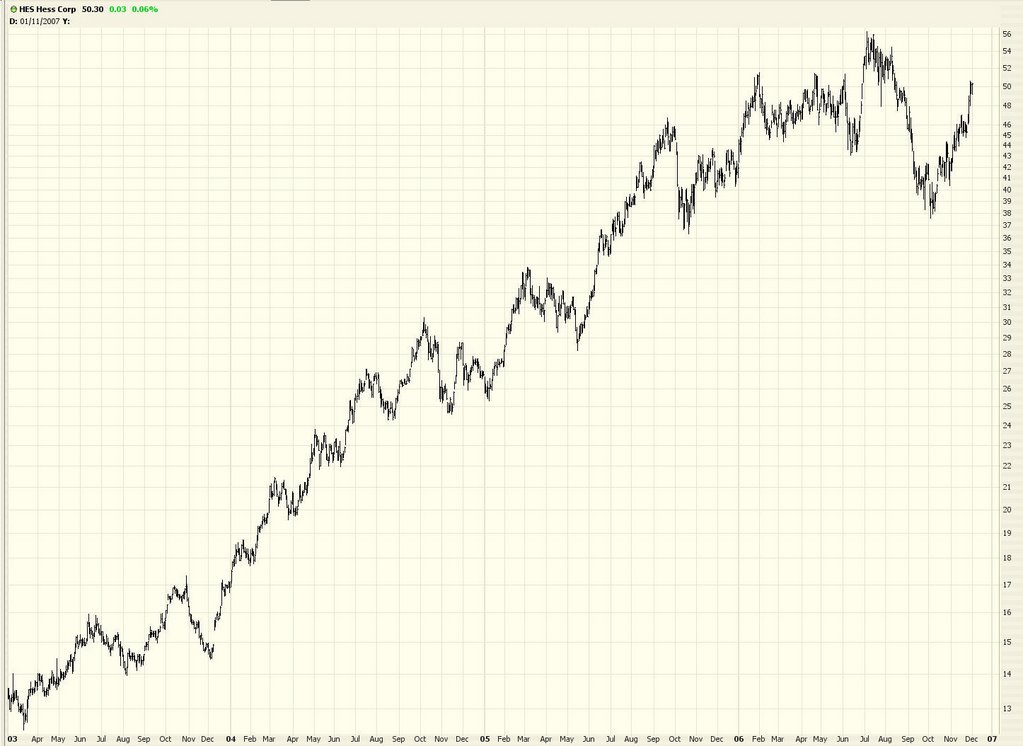
Sears Holding (SHLD) looks like its recent bullish breakout doesn't have legs either.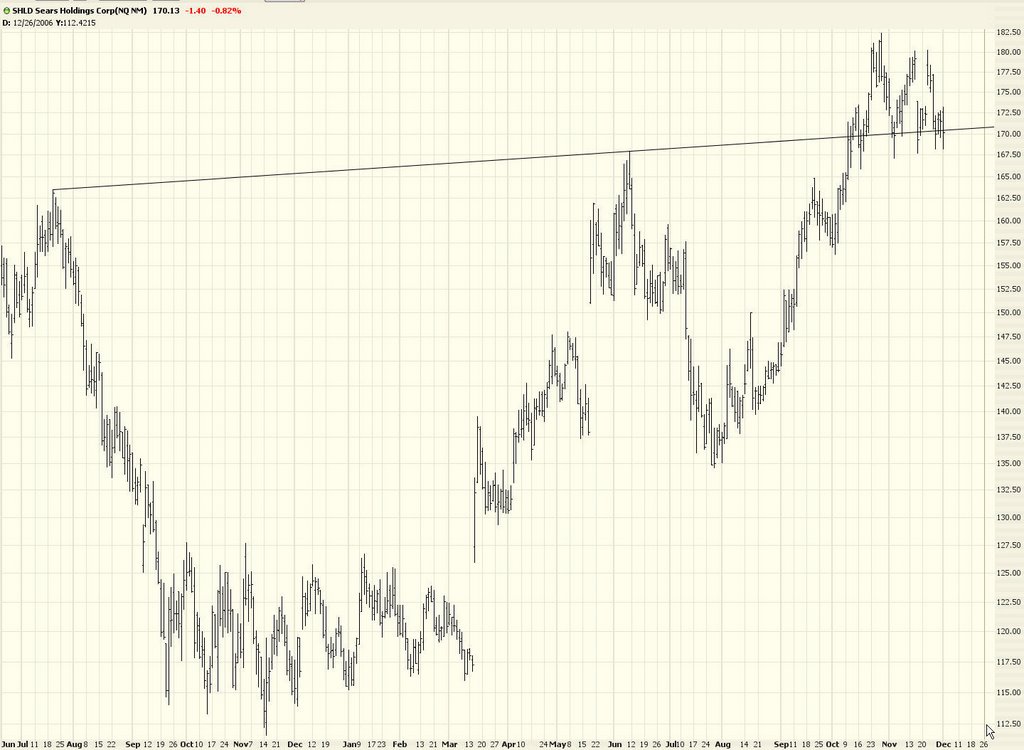
Lastly, US Steel (X) seems to have fully run its course. The beauty of all four of these suggestion is that the stop-loss levels are not only obvious but not that far away, so the risk is quite manageable.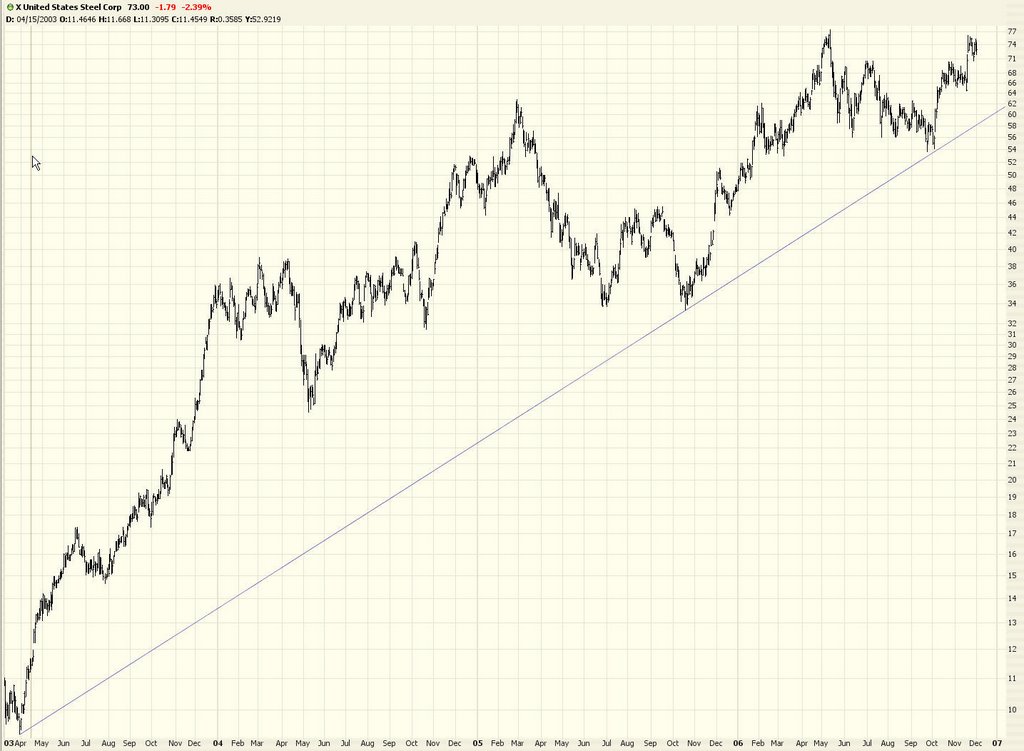
I appreciate your taking the time to check in with me. Have a good weekend.
29 comments:
I'm not sure how Tim comes up with his technical lines, bells, and whistles, but they sure help a lot. "Ye, of little faith." The Spy has to test the 50 day. Otherwise, I get to gag on some more single digit vix.
z-stock.
That rally late in the day.... was had the feel of short covering... 100 points in an hour on bad news- what a joke.
I think the market may be losing upside momentum and it seems they can only move stuff by rumours....pathetic. The good thing is oil is back..... inflation will go up and inflation may get nasty again.......
Dont get your hopes up the market keeps surrising everyone to the upside. What i see today is a succesfull retest of Monday's low.
I susect new highs by next week as the market i rotating out of the retailers and technology and into metals oils drugs and medical equipment. Having said that I think that there are some shorts setting up in the tech sector, particularly I like amd.
zeus111
Tim you seriously need to stop shorting stocks that are in uptrends. Like goog, X, shld. Come on man get real, you claim you use pure technicals and the charts you pick are the strongest charts out there. You pick stocks with strong uptrends and high relative strengths. You should know better than that. You may get lucky and get a reaction here an there but the odds are against you in the long run.
zeus111
It's not the bulls coming back time and again, it's the bears taking profits too soon, running on fear, not wanting to hold over the weekend. I was short from yesterday and closed my profitable positions today out of fear of "Merger Monday". Have a nice weekend Tim, and thanks for your good work...
Tim:
I would think that with your book coming out, you would want to at least seem to make picks on technicals. That is why it is so confusing that you don't seem to use much of any technical analysis at all when pick stocks. You seem to just look for strong stocks with simple double or triple tops and say short them.
Is this the kind of thing that your book is going to teach? I was looking forward to your book, but now I am starting to wonder.
For instance, you mentioned X as a short a week or so ago and now that it has run up even more, you are saying short it again. Could you give a bit of analysis on why your initial technical analysis was so wrong?
Thanks
attn: 11:03
X has to be one of the toughest puts to make. When Nue ( it’s partner in crime) went to a yearly high, maybe 2+2=4. X is probably going to a new yearly high, as well, and why not. Should Tim put up a chart that somehow shows X breaking down at 78/80? Probably. The thing that’s rattled Tim’s technical lines , as of late, on a very small handful of picks, are the pundits/analysts. They have been busy, raising the eps estimates after he posts. ( these are highly publicized conference meetings at seemingly random times. Still, one has to pay attention to them, like an earnings date.) They (the pundits/analysts did it to X (via Ati,last week) Ergo, missing info, which radically changes the technicals, literally overnight.
z-stock
At the very least Tim points out the KEY resistant lines.
As much as I admire what you're doing, Tim, I must admit that the last couple of posts have been accurate. You do seem to be putting up a lot of charts that have "high hopes" for shorts, but don't REALLY look like they're breaking down.
I do have a question for you: when you trade by "technicals," do you actually use anything OTHER than Fib lines? I see a couple of charts here and there that point out simple candlestick formations, and maybe an occasional RSI line, but nothing else.
I'd like to see something a little more detailed, if you could. Obviously, this is just a blog, but if you're going to advertise your "technical skills" by posting chart after chart, maybe you could at least put some MACD analysis, different RSI timeframes, a bit more candlestick analysis, some moving average lines, and possibly some simple support/resistance levels beyond a Fib retracement set.
When I trade technicals, I typically use moving averages, RSI, MACD, Chaikin Money Flow (my favorite), and support/resistance levels.
Anyways, just a thought. You're obviously not obligated to do anything at all. I'm just making a constructive suggestion.
-TonyB
"the stock market is a creation of man and therefore reflects human indiosyncrasy"
R.N. Elliott
let's use the aboce truism to profit from the beast!
ptcnukwl
all you wussies cashed out on short covering , rotflmao, how can u wussies drive the markets up 100 points in one hour, you guys are comical to listen to, and your fearless leader is something else .
Tims confused...
Technicals are for confirmation only - not for trading on.
Tims trying to trade his emotion - which is to be skeptical and negative.
This will only work on stocks that have the same technicals - ie: stocks that are falling.
But instead he tries to pick tops or pounce on a stock that starts to break - these are losing propositions.
Short what you can surf...
This site is a good contrary indicator - but provides a valuable lesson in how not to short.
It looks very possible that momentum is decreasing and that this thing is beginning to top out.
The end of the day on Friday seemed to be obvious short-covering. It would seem that the shorts are still afraid of this ancient bull enough that they cannot stand the risk of holding short over the weekend. Some decent decay in this market on a Monday or two might make a difference in the willingness of shorts to hold positions over weekends without wimping out and taking gains. Meanwhile, it appears that a potential top formation is beginning to set up.
Seems that even bulls cannot help making predictions that include more upside prior to an actual high in this bull. Wouldn't it be amazing if the thing just went down from here without any additional days of higher prices?
pb, Rate cut in 2 months?
Here’s an article I was reading last month. Here’s the copy and paste
********
• "The Institute for Supply Management's [ISM] purchasing managers' index came in at a weaker-than-expected 51.2 for October, down from 52.9 in September. The consensus was 53.0."
in the past, whenever the ISM index hit 51.2 while in a downtrend, it eventually broke below 50 -- the dividing line between expansion and contraction in industrial activity. "once it does that, history shows that the Federal Reserve cuts rates within two months." Therefore, watch the 50 level on ISM to help forecast the next rate cut….
z-stock
I scanned the page from TECHNICAL ANALYSIS OF STOCK TRENDS about prepararoty signals for short sales
by trend action
from Edwards and Magee. Quite insightfull, hope it is clear enough to read
http://www.msnusers.com/saaeed/shoebox.msnw?action=ShowPhoto&PhotoID=1
prepararoty signals for short sales
by trend action this is more clear
http://10sigmaevent.blogspot.com/
like the Goog idea,seems that people who own it will probably sell some in January to lock in gains and save on paying taxes on it in 2007, but could easily get scared out in December on any big pullback, dont you think the market markers know this and will bring the stock down so they could load up on it?
I wouldn't go 100% short stocks right at this time, bought would rather buy Jan/March Puts on some momo tech like RIMM or BIDU. Remember, the fund managers have their yearly bonuses to worry about, and will not let this rally falter until after 12-31-06.
Interesting Sentiment on this board...Bulls are convinced that the rally cannot fail......and are actually highly emotional. While bears are afraid to get near anything... THe DOW is up 15% for the year but more from the bottom....
There may be more upside but lets not kid ourselves ......this rally should be over shortly. Can anyone think of a reason this rally should go higher??? I can't- not one reason.
andrew755 ... you're right, there is no logical reason this market shd be trading at these levels, and it won't. But the reason it will go higher in the short term is two-fold:
1 - low yields beget higher stock prices, never mind the reason for the low yields, the market seems not to care at this time.
2 - the upsloping trendline is still intact. Judging by friday aft. action, we will power higher still.
The evidence is starting to pile up in the bears favour, and it will reach a point where it will be too heavy for this market to bear (pardon the pun). At this stage we are not there yet, but this market is definitely terminal. Be patient and wait for proper trend-line breaks, it will still leave you with plenty of downside.
Good Luck!
qjcdrldb
z-stock ... interesting ISM relation to rate cuts. As you know, ISM dipped below 50 on friday. The market's initial reaction was a sell-off, but it had managed to recover until Ford announced it's NOV sales figures, when the market began it's second round of selling.
Do you know the level of prior interest rates when the FED began cutting? Where they significantly above 5.25%? Also, where were commodity prices? Probably not as elevated as they are today. I still find it remarkable that inflation is not significantly higher due to the sharp increase in almost every commodity.
yeysi
Obviously Tim Knight doesn't read Decision Point.
http://www.decisionpoint.com/ChartSpotliteFiles/061201_rr.html
Andrew755,
do you think that, going forward, the Fed is more a friend to today's bulls or to today's bears?
Ahhh, it's good to see the markets up today.
Up, up and away!
Truly hilarious.
My favorite comment is that "oil is down to $63." HAHAHA!!
When oil was over $70, everyone was scared shitless that prices were out of control. But now that oil drops 20 cents to $63, everyone's happily buying into the markets.
Wall St. crooks are a curious bunch. It's a miracle that ANYONE actually can make money in the markets. Unless, of course, you just blindly pour tons of money into the markets day after day on the long side. Then it's easy.
I think Tim has a secret agenda. Tim is certainly not a technician because the number one cardinal rule is trend is your friend. He clearly violates that rule repeatedly. Personally, I think he subconsciously hates American capitalism. He wishes the economy will go sour and companies go bankrupt.
another uo day, what else is new.
That's exactly it, DO NOT THINK, JUST BUY AND BE STUPID!!!!
Simply Amazing my bear friends. Just when you think the markets falling apart it pieces itself back together again like nothing is wrong. Last week we had some of the worst economic numbers hit these markets, add in a late day market rally on Friday, and Monday is just another sunny day on wallstreet. I think the markets do head higher, how high from here is anyones guess. Im sure this week sometime we will see another new record closing, if we do it will be time to just sit tight and wait till the next triple digit loss to add a few longs. The strenght is incredible. On an up note though I believe the volatility is back and is very strong. The thought of a triple digit decline had increased dramtically over the past week.
Next big day is Friday, expect much volatility after the job report. Im sure the media will spin in either direction to show it as a positive.
Trader 2006.
volume huge on DOW today...
what's that mean: buying with conviction? or volume exhaustion spike?
Compare the NDX chart pattern of today to the April-May highs. Do you notice any similarities?
Note that although we have had a strong day, momentum is still not uptrend.
A top will take time to develop....especially after such a bull run as we have had since last summer. This is an old bull.
Post a Comment