
The Market's Big Picture
It's particularly important for me to note that clicking on any image in this blog yields a bigger version. This post contains a couple of really important and fascinating graphs that really should be seen in all their glory.
Anyone who has read my blog knows my view on the market is very bearish. I believe that the Dow 30 will lose about half of its value within the next ten years. Below are a couple of graphs of a broader index, the S&P 500, to back up this belief.
Here is the S&P 500 dating back to 1928 with a Fibonacci fan drawn from two extremes: the bottom of the Great Depression to the top of the recent bubble.
What fascinating about this is how the prices tend to be bound by fan lines. Take a good look at the graph below; I've made it easy to see by drawing a rounded rectangle around major instances (which often span many years - even decades):
More recent history shows that the S&P is bouncing along one of the fan lines. It needs to break below this fan line to make its next serious move down. As you can see, it's already pierced below this fan a few times, only to move above it again. But if it moves below it without recovering, you can expect the S&P to move into the high triple digits afterward.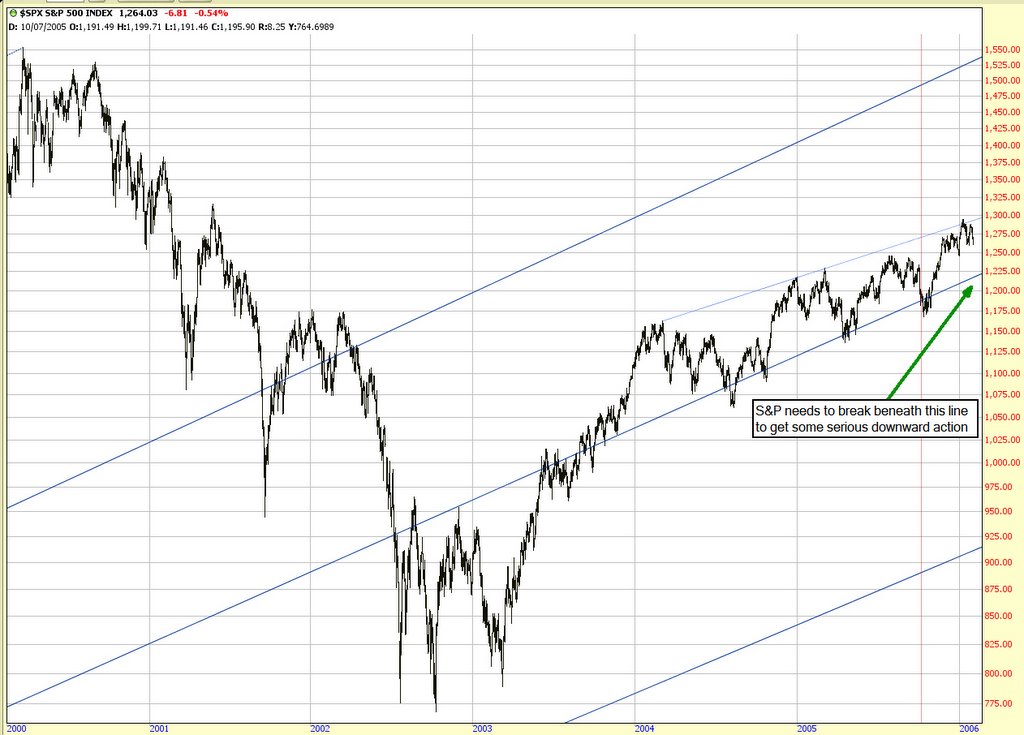
Confutatis maledictis,
flammis acribus addictis,
voca me cum benedictus.
Oro supplex et acclinis,
cor contritum quasi cinis,
gere curam mei finis.
8 comments:
Trader Tim, thanks for the very informative observation regarding your longterm views of the S&P 500. I agree and I believe that it is even more noticeable when you draw a channel connecting the Aug 04 and Oct 05 bottoms for the bottom channel line and using the Jan 05 high to establish the top channel line. This channel clearly shows that the S&P 500 has become weaker since Jan 05! Thanks for providing such an excellent service for traders and investors. Regards, Trader Joe
Tim,
I think most 'students' of market history agree with you. What has changed is the flagrant manipulation (intervention) of normal market and business cycle structure by the Federal Reserve. The massive injection of liquidity via both fiscal and monetary policy on Greenspan's watch has created unthinkable imbalances. The only fear out there is fear of missing.
Another recent trend, massive option selling (lowering volatility) to squeeze out yield also puts many investors at incredible risk.
Finally, the housing bubble, well elucidated by Jeremy Grantham (at www.gmo.com) and others also places another nail in our investment coffin.
Great stuff.
This will be a very bad week for the DJIND and SPX with continued selling. The DJIND has not made new highs despite low unemployment falling crude prices and relatively good earnings.
Your long-term views of the S&P 500 are incorrect.
While I am a believer in technical analysis, technical indicators cannot predict economic outcomes – and that’s the only data you’ll be getting when you draw charts dating back to the great depression. Taking Google for instance, you can have a relatively good idea in what range it will trade up until next quarter’s earnings; however, when that all gets thrown out the window. From there it may go up or may go down but you can’t use technical analysis to predict that – you need economic data.
I don’t think drawing Fibonacci fan all way back to the great depression is a good technical indicator. There is a lot that can go on such with future innovation that can raise stocks higher or terrorist attacks to bring them lower. If you look a thousand or even a million years into the future – you will see spreads of an ungodly amount of points just amplifying the irrelevance of Fibonacci long term.
Based on what I’ve read through your archive, I’d say you have a very biased opinion. You aren’t even seeing that the Dow is only 900 points from a new all-time high. You cheer stocks when the go down and hiss when they go up. You short out on everything thinking its only corruption that brings stocks higher which just amplifies your hatred for America – or at least the corporate side of it.
If you go back to 1928 to compare markets, you also should consider the degree by which the measuring stick (dollars) has been depreciated during that span of years. Barrons ran an interesting chart in its October 22, 2005 issue. The chart showed that by 2004, the dollar of 1930 had lost 92% of its purchasing power, i.e. it is worth only 7 cents today.
At age 91, I have lived through that devaluation, and it is only because I have understood what was happening that I now have a good retirement.
The point of this is that, in my view, the present levels of market indexes only represent (1) primarily an adjustment to this devaluation, plus, of course, (2) a relatively modest adjustment for improved productivity.
I fully expect that the next 20 years will see the dollar lose 50-70% of its present value, which hardly fits with your scenario of a major drop in the markets.
Frank Bliss
I think you are right on with you SP500 view. This is why I have elected to start with Bear Call Spreads on this idex instead of starting with Bull Put Spreads. Of course if I can find an oppertunity to add the oposite side for an Iron Condor, I am all over it.
-Scott
Tim,
Just wanted to post a 'thank you'. I'm learning about tech. analysis
and you're blog, ron sen's blog and a few others have been very valuable.
Keep up the great work.
-Mark
Tim, your analysis is interesting. I use "free" prophet charts and have come up with a similar analysis using channels.
I have to laugh at the person who says we are close to a new high on the Dow. I guess he/she doesn't follow history. We've been close since 1998 give or take a few points. And we were close from 68-82 but didn't get the ceegar.... and on and on...
I use TA for my investing as well as trading but I don't predict. I take what the market gives me. I think predictions are quite impossible over time. Variables change over time and new variables are introduced. I'm quite nervous right now but I'm bullish long term....But maybe I won't be when that long term actually unfolds.
Let's see what happens when we have a crisis and all of these fancy schmancy new derivatives are put to the test on a massive scale of unknown outcomes...........
I agree with Ron on that point.
Ta Ta.
Post a Comment