
When Good News Can't Help Anymore
There were two very important economic reports that came due this morning.
The first was Durable Goods Orders. The consensus on this figure ranged from -.5% up to +2.5%. The general consensus was 1.8%.
The figure came in at a totally unexpected 3.4%, far stronger than even the highest estimate.
Half an hour after the market opened, another key figure came out: the Consumer Confidence Index. Its consensus range was from 88 to 92, with 90 being the average consensus. Once again, the actual figure blew away the estimates and came in at 98.9
What'd the market do? It shot up, of course. The Dow was up 70 points early in the day.
Then it started easing. And kept easing. And kept easing.
Where'd the market close? Up 50? Up 25?
The answer: the Dow Jones 30 closed down 3 points today.
Now, why does a gentle technician like me care about all this? Because if fantastic economic news can't keep this market from going limp, what's going to do it? Anyone? Bueller? Bueller?
I think you see what I'm getting at. If even great news can't move the market up, we bears don't have to fear it. Because what's going to happen when bad news comes out? Well, it probably won't be great for the bulls.
The market peaked today at 10,960, just 40 points shy of the psychologically key (but otherwise completely meaningless) 11,000 on the Dow. Google, mentioned yesterday as a stock on which I owned put options, closed down nearly 20 points (20 points! Most stocks aren't even worth that much!)
In my view, the market (as measured by the $SPX) peaked on November 23rd at 1,270.64. Look at the graph below, and notice how beautifully all the Fibonacci retracements line up: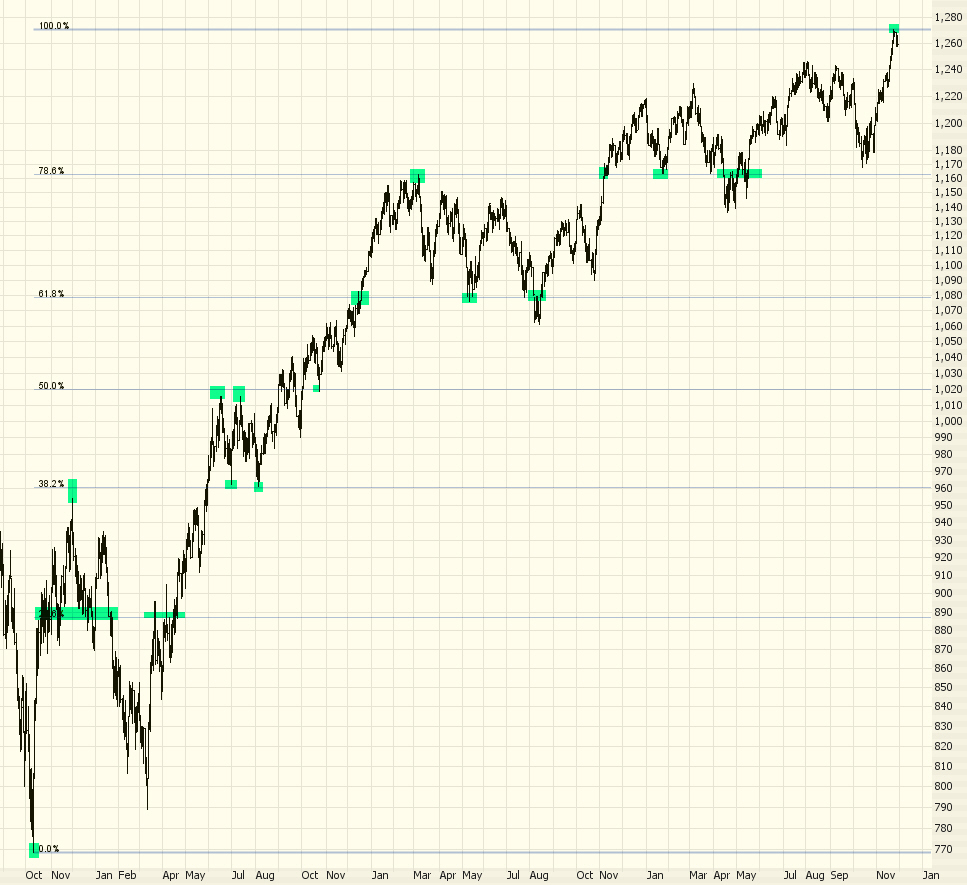
I'd also like to point out the amazing shooting star pattern on the Dow. It's absolutely textbook!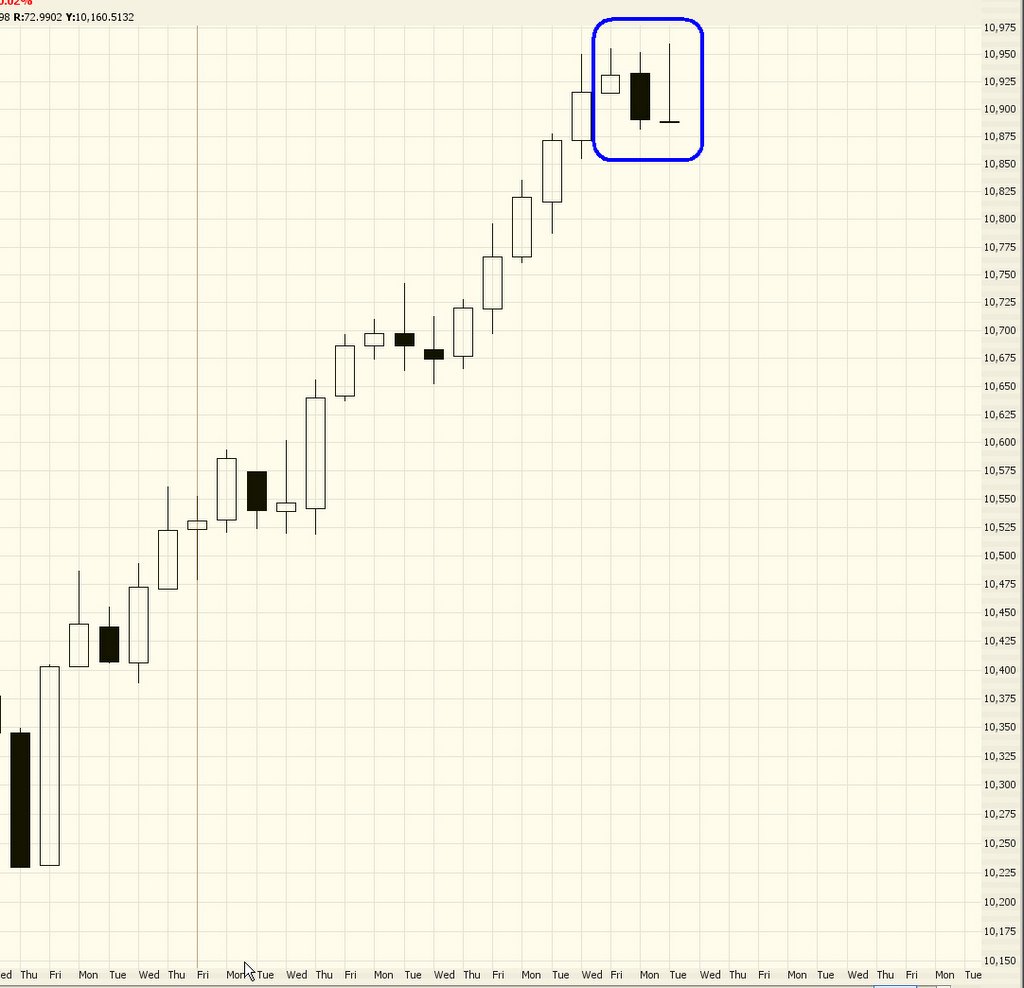
There's about a month left in the year, and the Dow is currently up 1.5%. Hopefully the Dow will close out the year at less than 10,783, which will "break" this decennial pattern and be another feather in the cap for the bears.
1 comment:
Great blog Tim... I believe the "one zero" points on the very long term DJ-30 chart to be important resistance points, and if we go back to the Dow 1,000 and 100 levels we can clearly see that.
True, the Dow has broken above the 10,000 level, but it has had an extremely tough time doing so, so the "one zero" resistance phenomenon remains in effect in my opinion, and it would not be very surprising to me at least if we are on the road to another significant correction or new bear market relatively soon.
Post a Comment