
Using Retracements Short- and Long-Term
Today's entry is going to be about using multiple Fibonacci retracements in different timeframes. Now, wait, wait; don't roll your eyes and turn on the TV just yet. This isn't as dry as you might think. Stay with me on this one.
The general point is that using the Fibonacci retracement is very useful not just for long term analysis but short term as well. On one given chart, you might have two, three, or even more retracements drawn.
For those of you relatively new to these, they are quite simple to draw - typically the reference line is drawn from one price extreme to another, and the retracement lines are automatically placed on the chart. Take one of my favorite examples these days - the NZD/USD currency pair (New Zealand/US Dollar). I have been touting this as a short position for quite some time.
Look at the chart below (frequent reminder: click on it for a bigger view). It shows the NZD/USD over the past couple of years. I've highlighted in green where the price tends to "hug" or bounce off of the various retracements. I find this behavior uncanny.
Although you can just barely see it, I've drawn another retracement way up in the upper-right hand corner of the graph. This is for just the past few weeks of activity. Below is a zoomed-in portion of that graph. Once again, you can see how the prices line up beautifully.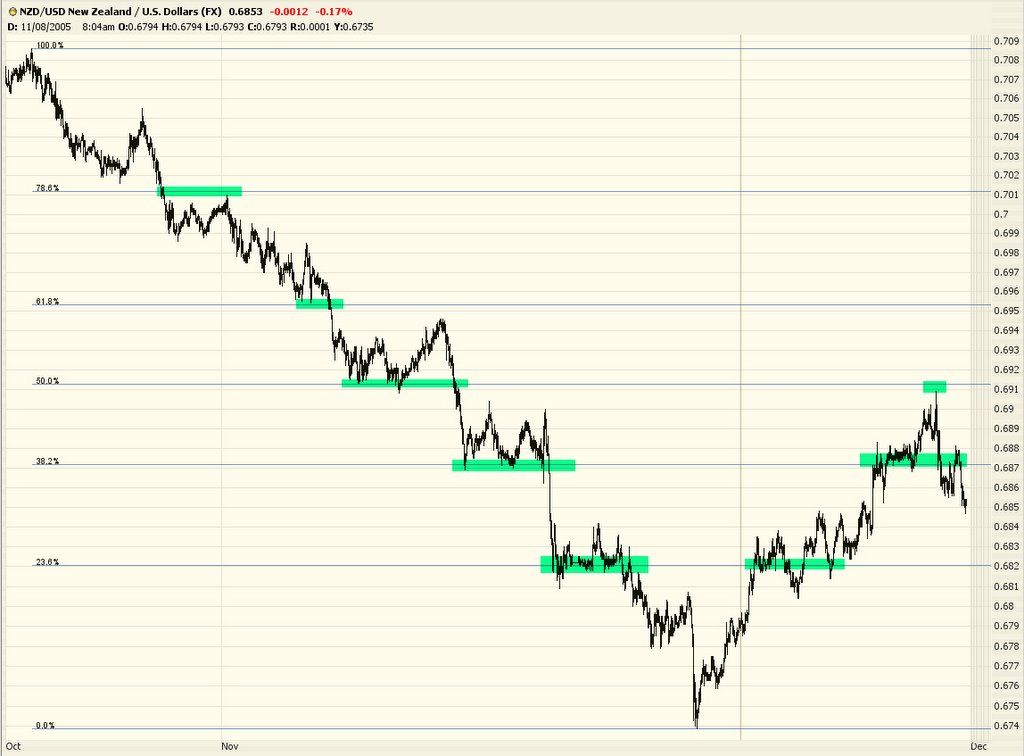
As you can see, these retracement levels are invaluable. If you are "between the lines" and moving either up or down in price, you already have advance warning as to where the price is probably going to pause. In addition, once it breaks through a price level (either up or down), you can have a higher degree of confidence that it will move more smoothly from that point until the next level is reached.
No comments:
Post a Comment