Thursday, June 30, 2005

Multiple Head & Shoulders Patterns


Finally the market has broken out of its boring funk and has established a direction - down. Which is what I've been waiting for the past two months.

The graph above is particularly interesting. It's of the NYSE Composite index (symbol $COMP), and I've found not one but three head & shoulders patterns (I have marked the shoulders with S and the heads with H to make it more clear). Remember, these can be both bearish (the normal kind) or bullish (the inverted kind).

The first two you seen, which I've highlighted, are inverted, and you can see the subsequent price increases. The third, and most recent, is the regular head & shoulders, although this pattern is still forming and has not yet broken the neckline at 3,195. A break below this should lead to a fall to at least the 2,900 level.

Monday, June 27, 2005

Breakout for APCS


The market fell hard last Thursday and Friday. I think it's going to be in a consolidation/slight recovery mode in the short term before falling again in earnest.

In the meantime, check out APCS. It broke out of a dish pattern today to a new high on good volume. All the elements of a good stock to buy.

Thursday, June 23, 2005

Market Getting Squishy


Today was the first really good day for bears in about a month.

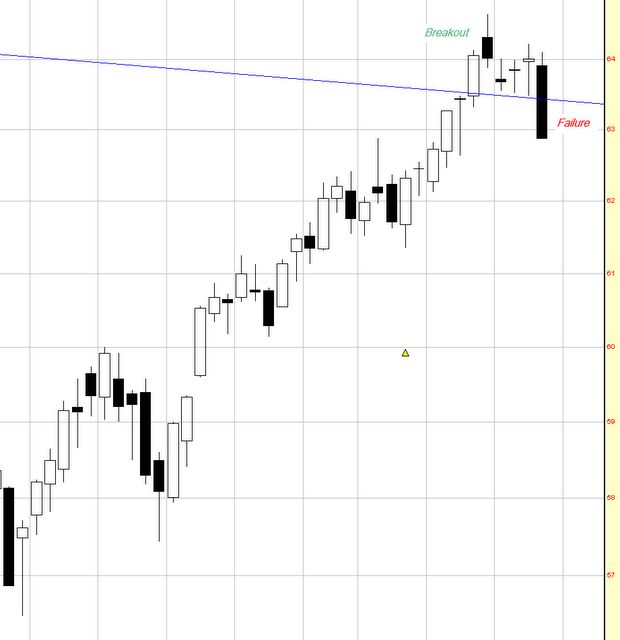
As I mentioned recently, the Russell 2000 - which I've been following closely, pushed above its descending trendline a few sessions ago. I mentioned that if it moved upward and didn't get beneath the trendline again, the nature of the line would clearly have changed from resistance to support, and the bears among us would be in trouble.

What has in fact happened is the indexes all moved down hard today, and as you can see in the chart above, IWM (the ETF for the Russell 2000) is once again beneath the descending trendline. This is bound to be disappointing to the bulls, because after an entire month of "winding up for the pitch", the ball didn't go out of the stadium but simply plunked back down to earth.