
Bull Run or Bear Trap?
I've been tracking the Russell 2000 ETF (symbol IWM) not only because it is a very broad-based instrument, but also because it's been by far the strongest of any of the index ETFs for the past year. If the IWM really starts to break down, it's a serious bearish signal. So far, this has not happened. On the contrary, the IWM has shown amazing strength and resiliency. Click on the image below to see a larger picture: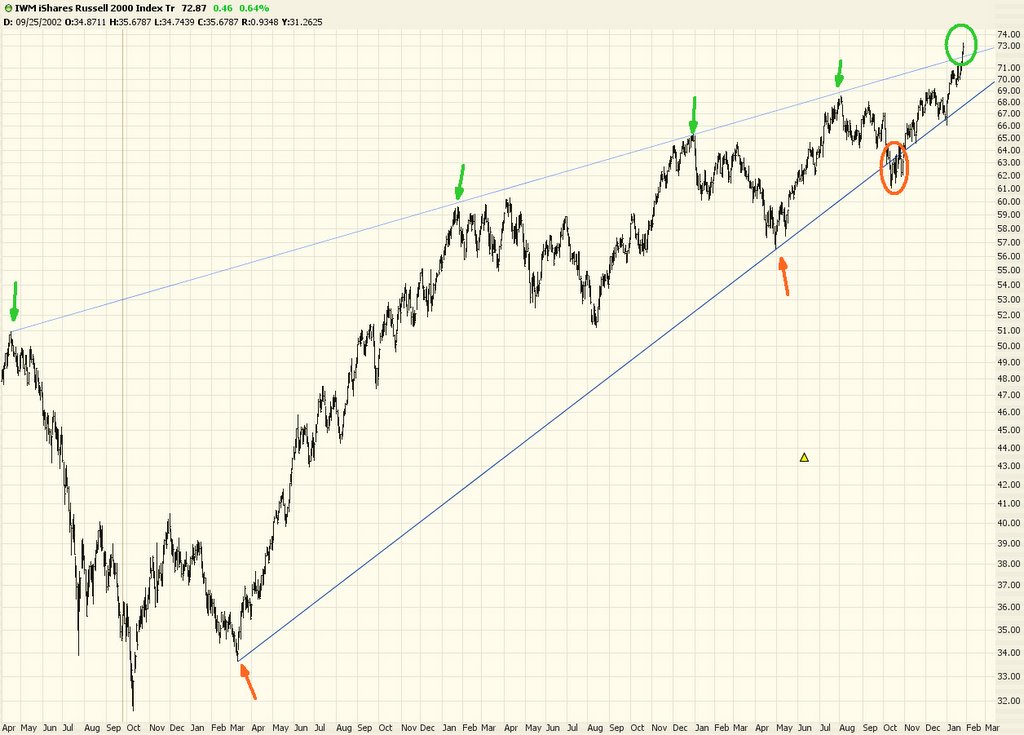
As you can see, the index has been creating an ascending wedge. Although it has historically bounced off its support and resistance (indicated by the arrows), it did appear to break beneath support in September, highlighted here with an orange circle. However, this was a false breakout, and it pushed back into its wedge and has been moving up pretty much ever since.
I stated in an earlier post that the IWM was pushing on a resistance level again. As you can see, it has now broken above this level. So the question at this point is whether it, like its cousin in September, is a false breakout, or if it represents a true breakout above the wedge.
We should know in the next couple of weeks. If the price can stay above this trendline, then resistance has changed into support. However, if the price sinks the trendline back into the wedge, this is just as bearish as the push away from the false breakout in September was bullish.
5 comments:
Hi Tim,
Very interesting! I don't quite understand why you track the IWM rather than the Russell 2000 index itself. I can see the benefit of having volume along with the other indicators on an ETF, but becuase it is a tradable equity, as opposed to the index, isn't it then a somewhat altered version of the actual index as a "snapshot" of market performance? I don't know enough about how these ETFs are actually built and operated. Nevertheless, I can't see why the ETF being traded should be a real problem, but bidding and price pushing on it like any stock just brings up the question of what is more important and/or gives a clearer picture.
Thanks. I'm learning a lot from your posts.
Well, my thought is that I'm nervous. I've got puts on Google right now. But I feel this is like playing roulette. GOOG will either go up a lot or go down a lot. I'm tempted to close the puts for fear they drop 90% on Wednesday morning if earnings are killer. But I'm wondering if I'd want to beat myself up for doing so if Google drops down to $350 or something dramatic! I'm still on the fence. I have no insight into earnings, obviously. The chart is kind of in a middleground right now.
Google is going to rock to all time high very soon. Time to close your put position and buy some call position now if I were you. The stock market is in a super bull mode right now with $rut, $mid, $nya, $tran, $util, $bkx, $xbd, $xoi, $osx all in or near ALL TIME HIGH.
Dow, S&P and Nasdaq are near multi-year high. This is no time to be bearish.
Do a straddle on GOOG...make some coin on the volatility.
Only tomorrow will tell but after hours today Goog is not looking like it going to blow out of any waters anytime soon. Missed earnings and overall not so hot in the news... So far the trend continues as "what Yhoo does on earnings so does Goog". Goog's gonna need a rabbit in a black hat to come out of this one. Tomorrow should break to the bottom of the falling wedge set up in the last month. Still in your put Tim? Straddles are too expensive on this one for my blood.. I'd go with a nice safe spread play (bull put 250/270 for .50 yesterday)
Post a Comment