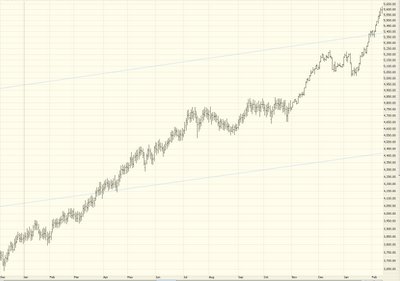
Going Nowhere Fast
Yes, I know the market was up some today. And it was up some yesterday. But the fact is that this market is stuck without any clear direction - either up or down - and it's maddening.
Here is a chart of a true trending market; this was back in 1995 and the first part of 1996. The market pushed higher, virtually uninterrupted:
Here, on the other hand, is the recent history (intraday) of the S&P 500. Up. Down. Up. Down. Churn, churn, churn. It's going nowhere fast.
Why is this? Well, one reason is that in spite of all the talk of "5 year highs", the market still has a fair bit of overhead resistance to conquer. Even the Dow, which is nearer to historic highs than any other major index, isn't out of the woods left. Notice the highlighted area representing overhead resistance, and it's no wonder earnest attempts to push higher get repelled.
The market hasn't had any reason to move up or down in a meaningful way. Even though I'm a technician, I admit that earnings do drive share price, and there will be a lot more clarity in the coming weeks whether the market is going to shake off the doldrums and blast higher or if it'll succumb the the pressures of a tired bull market. In the meantime, feel free to share your own views and specific recommendations in the comments section.

4 comments:
Excellent! I'd love to hear other recommendations.
Looks like the intermittent bottom on friday is getting confirmed with todays market action. Its heading for its prior intermittent top. It seems like there is still a lot of selling that comes in at these levels. The good thing is, its being absorbed.
The international markets have been rocking lately, which makes it hard to commit large positions at these levels. If the market does break this overhead resistance, we should see a lot more money flow into the markets.
It's hard work being a bear. I was hoping for a nice tasty correction in March but it didn't come. There was weakness yesterday
and strength today.
A watched pot never boils. I'm gonna try being bullish to see if that'll "jinx" the market into a crash.
-sigh-
-Mike
Intraday, the movement of the last few months or so is basically equivalent to the intraday movement of the S&P 500 in late 1995 and early 1996. Download the data and graph the 63 DMA of the intraday range divided by the previous day's close and you'll see what I mean.
Likewise, in the first quarter of 1996 you had daily pullbacks in the S&P 500 index of 3.1%, 1.8%, 1.5%, and two others above 1%. What's the biggest daily pullback of 1Q 2006? 1.8%, and only one other day pulled back 1% or more. Early 1996 was more volatile than early 2006 has been.
Post a Comment