Pivotal Point

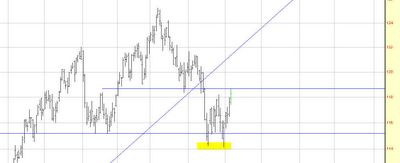
All of the equity markets have been generally upward for the past four days (April 29 through May 4) and were mixed today, May 5. As a bear, I appreciated seeing some red numbers for a change! The graph above shows the MDY over the past few months. The head and shoulders pattern is still very much in place, but we don't want to see the MDY cross above that horizontal line which equaled today's high.
Anyway, the S&P 500 and the Dow 30 have both broken above their descending trendlines, which although discouraging isn't so horrible since these are relatively short-term lines. The big picture remains unchanged.
At this point, we're going to need to see some pretty earnest downside action to confirm our suppositon that the market is headed much lower. It was unfortunate that the new lows reached early in the morning of April 29th didn't follow through, and the markets actually closed up for that day (this double bottom is shown as highlighted yellow in the graph above).

No comments:
Post a Comment