
Bulls Still Struggling
The market opened strong this morning, with the latest economic report showing the lowest inflation rate in years. But when I clicked over to see how my dozens of short positions were doing, I noticed most of them were "in the green." And it didn't take long for the flimsy rally to fade away, as the market entered negative territory and stayed there for the rest of the day.
Let's take a fresh look at the VIX, the measurement of volatility on the S&P 500. Years ago, this indicator would typically range between about 20 (low volatility, usually indicating the top of a market) and 55 (high volatility, often preceding the bottom of a market).
Ever since early 2003, however, this indicator has sunk to never-before-seen levels. It currently reads an almost record low of 10.73, which might suggest an important top in the market.
Here's a chart showing the VIX (black line, right scale) versus the S&P 500 (blue line, left scale) over the past 3 1/2 years. As always, click on the image to make it larger so you can see it better. Look at the picture and judge for yourself what this chart might be telling us. I've put some green highlights to ilustrate how these two charts are often "mirror images".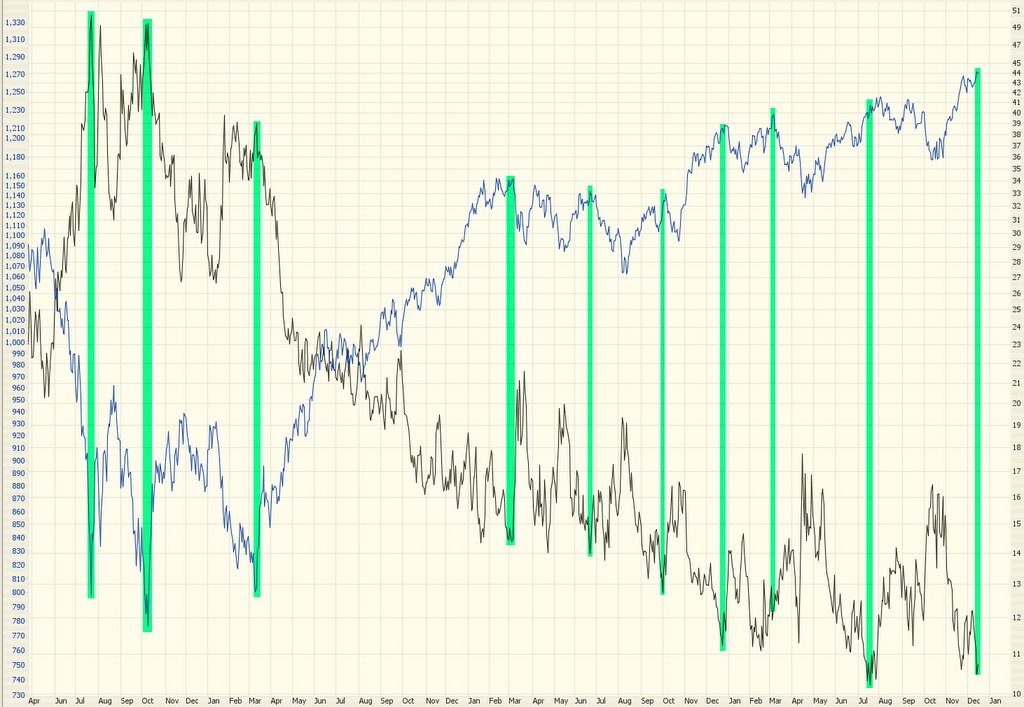
No comments:
Post a Comment