Friday, December 30, 2005

The Decennial Pattern is Broken

The trading year of 2005 is over, and the bulls lost.

When entering this year, the bulls were counting on many winds blowing in their favor, not the least of which is the famed decennial pattern. For one hundred years, the bulls have had this at their side. Well, it didn't work this time. And I believe this represents the shape of things to come.

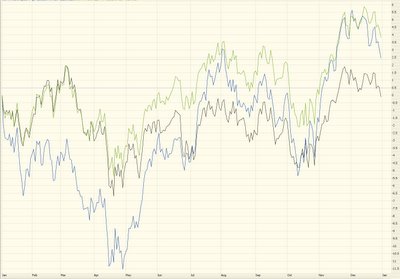
Below is a graph showing the percentage performance of the three major stock market indices this year. The Dow (which, importantly, had a loss for the year) is shown in black. The NASDAQ Composite is shown in blue, and the S&P 500 is shown in green. As you can see, even the strongest of these indices produced a return even more meager than what a risk-free CD at a bank would give you.


Regular readers of my blog know where I stand, so I won't belabor the point. I'm looking forward to 2006 as a year when the market really starts to fall to pieces. There will be tremendous trading opportunities all around.

I've enjoyed writing this throughout the year - - it seems like ages ago, but I only started in April - - and I'm looking forward to sharing my (sometimes overly opinionated) opinions with you in 2006. Happy New Year to one and all!

Thursday, December 29, 2005

The Moment of Truth

Well, folks, this is it. One day left. And, as of the close today, the Dow has a change on the year of ZERO. None. It borders on a statistical impossibility. After hundreds of days of wild market gyrations, the market has gone precisely nowhere.

So tomorrow, December 30, will represent the entirety of 2005's change for the Dow Jones Industrial Average. My fingers are crossed for a down day, but with no news at all on the horizon and a long weekend ahead, it's bound to be a quiet (OK, boring) session.

See you on the other side!

Tuesday, December 27, 2005

Rudolph's Light Goes Dim

The first trading day after Christmas - Tuesday the 27th - was anticipated since people felt the Santa Claus rally would finally kick in, shoving the Dow cleanly over the 11,000 mark and giving 2006 a good rolicking start.

It looked that way at first. Early indications of holiday sales were quite strong, and the Dow swiftly moved up about 50 points. And then the same "rally....then fade" pattern took hold. After reversing 156 Dow points, the Dow finally closed with a triple digit loss. And it is once again in negative territory for the year 2005.

We have three days - 19.5 trading hours, to be precise - left in the year. As I've mentioned numerous times, closing below 10,783 on the Dow by year's end would break the never-before-broken Decennial pattern (for years ending with the digit five).

We are just a hair beneath 10,783 at this point, so it's way too soon to call. But I don't think I'm going out on a limb here by saying that - - after ten failed attempts to break 11,000 over the past month - - odds are that we're going to stay on this side of 11,000 and, at most, end the year with a gain so small on the Dow that it would hardly be worth measuring.

I've started to notice an interesting phenomenon lately, which is that many of the brightest shining stars have started to weaken considerably. Indeed, even when the Dow was up 50 points on Tuesday, one of the hottest performers of the year, NutriSystem (NTRI) was down a full 10% (which meant the puts I owned on it were up well in excess of that).

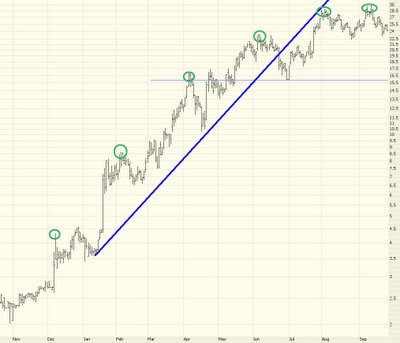
Shorting these momentum stocks can be risky business, but let me point to a recent example that was a pretty clean trade - Forward Industries (symbol FORD). Here's what the stock looked like over the past year or so. Notice this important fact - - although the stock was pushing higher, the momentum was clearly slowing.

I've circled the ascending highs to try to make this point more clear. I've also drawn a sharply ascending trendline to illustrate how its role as support plainly changed to resistance, thus indicating that at least the "straight up" direction of the stock was slowing down.

When I saw this stock a couple of months back, I was intrigued. What kind of business is this? I did a bit of research and found they were in the business of - - hold on to your hat - - cell phone covers. You know, like cases. I was floored. I don't pretend to know anything about that business, and I couldn't argue with the success of the company, so they must have been doing great. But cell phone covers? Was that really a rock solid high-growth business with high barriers to entry?

I kept an eye on the stock, and when it made another thrust upward, I shorted it. I've put a circle on the chart below to indicate where I went short the stock.
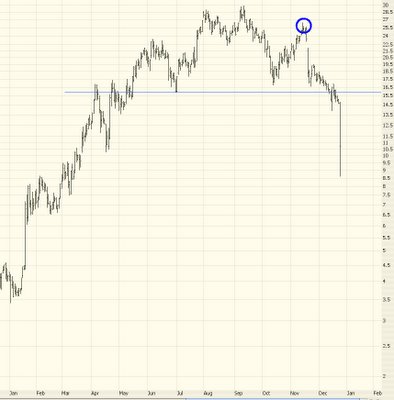

A few days back, FORD announced revised expectations, and the price just swooned. You can even make out a pretty decent head and shoulders pattern. My point here is that waning momentum on a former high flier can make for a great short.

Some other high fliers (which may or may not turn out to be great shorts......only time will tell) including GOOG, HANS, WFMI, and, as I mentioned before, NTRI.

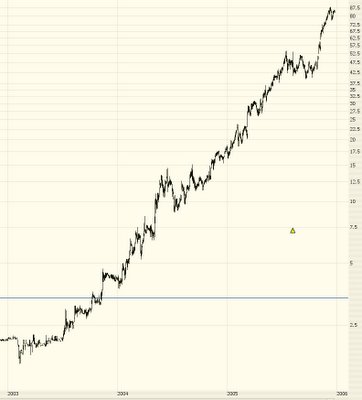
NTRI, shown below, has had a huge run up. If the broad market continues to weaken as it has been, and this stock doesn't regain its momentum, a trade like this could be a terribly profitable short, particularly if you're willing to take on the even greater risk of owning a put option position instead of a straight equity short.

I'll be sure to put up a post shortly after Friday's close to find out if the Dow wound up in the plus or minus column this year. It's going to be a photo finish!
Thursday, December 22, 2005

Borrrrrring.........

This market just can't make up its mind. A little up. A little down. Then a little up. And a bit down. Make up your mind! Sheesh!

Maybe this will be my last pre-Christmas post. Just wanted to let you know I'm still here. As I've said, if the Dow blows past 11,000 with force, the bears are in big trouble (umm, that would be me) and there are plenty of great looking saucer and inverted head & shoulder patterns around. But this market is doing nothing!

Well, happy holidays to you and yours, and let's hope this market decides to do something with itself sometime soon! A clear direction would be a welcome change.

Monday, December 19, 2005

The Bulls Will Fail

With each passing day I like this market more and more.

The sneering, smirking bulls, with their obsession over "Dow 11,000", keep failing to do it. They just can't. No matter what favorable news blows their way, and no matter how many millions of people are falling all over themselves to push the market higher, it's not working. The market's not going up.

What's cool is that every morning they try again, and they fail again. As I've said in the past, this is exactly what we want to see. The market opens, they stamp their little hooves and push the market 30, 50, 70 points higher.....and it stalls. And starts slipping. And spends the rest of the day giving those gains back and, more often than not, closing lower for the day.

There are now just eight trading days left in the year. At this point, for the entire year, the Dow has gain 53 points. I am hopeful that minuscule gain will be wiped out and replaced with a loss before the year is over so we can throw this decennial pattern in the garbage where it belongs.


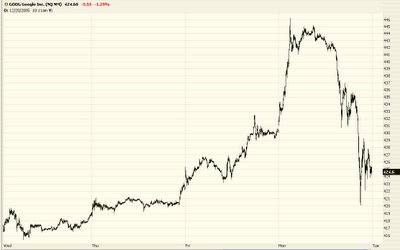
Now let's take a look at the current insanity, Google. About a week ago or so, in an attempt to outdo other analysts, one stock analyst made a projected price target of $500 for Google. What's this thing with big, round numbers? Does this guy really get paid this much to just dream up a big round number? Is there actual analysis behind it? What about $600? Or $700? Why not a good old 1990s $1,000 price target?

Well, anyway, Google shot out of the gates today because they look close to catching some of that AOL magic (take a good look at the dog TWX stock to see how much life is left there). It was up $17 or so, blasting to another lifetime high. And it stalled. And started sinking. It finally closed down nearly $6 for the day. A daily range of something like $25. I actually had bought puts on it near the top but chickened out. Just look at this insane intraday chart (below is about the past 5 days).


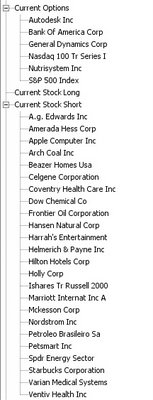
I am hoping 2006 will put us in a position where the bears really take charge. We're sort of gently tapping the bulls away at this point. I'm wanting to rip a few thousand points out of the Dow and see real blood in the streets. 2006 could be the year for that kind of action. Below is a list of all my current puts and shorts. All of them are already deeply profitable, and I'm counting on many gains to come. Let the games begin!

Thursday, December 15, 2005

Bulls Still Struggling

The market opened strong this morning, with the latest economic report showing the lowest inflation rate in years. But when I clicked over to see how my dozens of short positions were doing, I noticed most of them were "in the green." And it didn't take long for the flimsy rally to fade away, as the market entered negative territory and stayed there for the rest of the day.

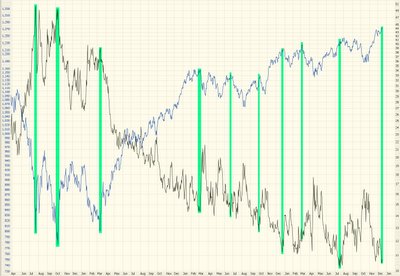
Let's take a fresh look at the VIX, the measurement of volatility on the S&P 500. Years ago, this indicator would typically range between about 20 (low volatility, usually indicating the top of a market) and 55 (high volatility, often preceding the bottom of a market).

Ever since early 2003, however, this indicator has sunk to never-before-seen levels. It currently reads an almost record low of 10.73, which might suggest an important top in the market.

Here's a chart showing the VIX (black line, right scale) versus the S&P 500 (blue line, left scale) over the past 3 1/2 years. As always, click on the image to make it larger so you can see it better. Look at the picture and judge for yourself what this chart might be telling us. I've put some green highlights to ilustrate how these two charts are often "mirror images".

Tuesday, December 13, 2005

Breakout........or Failure?

Today, for the 13th time in a row, the Fed increased interest rates. Perversely, the market rallied on the news (supposedly because there was a suggestion that perhaps the rate hikes would stop). It wasn't that many years ago there was a saying about "three steps and a stumble" (in other words, three rate hikes in a row preceded a bear market). I guess even 13 hikes haven't done the trick yet.

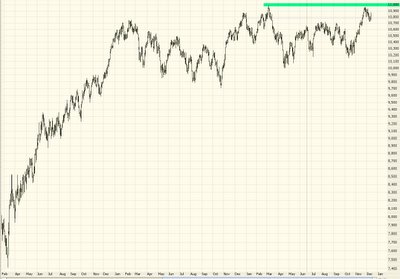
The market has been going nowhere for a long, long time. The flip side of this, however, is that when the market does finally decide to go somewhere, the move will be substantial. Even I, Mr. Bear, concede that if the Dow breaks 11,000 in a meaningful way, the market is going to rally strongly. There is simply too much pent up energy to hold it back. Conversely, if the market keeps failing to penetrate 11,000, as it has done repeatedly already, the market will finally succumb and wilt downward.

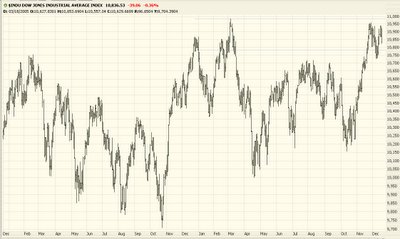
Take a look at the past couple of years of the Dow 30; notice where I have marked the 11,000 threshold:


There have been two earnest attempts to pierce 11,000. If it can't "punch through", the bear market I've been yacking about all year will finally start to take hold. Until then, everyone - including me - is in wait-and-see mode.

The market will either have the strength to push itself past the resistance that's been holding it back for many months, or it will finally throw in the towel as people rush for the exit doors and take profits as quickly as they can.

Thursday, December 08, 2005

Cute with a Capital Q


I'll stifle all the bearish hoo-ha for a day and mention one honey of a stock pattern - Qwest Communications (symbol Q). This is a fantastic inverted head & shoulders pattern with a good volume and price spike today.

I've mentioned this stock in the past, but I wanted to put out a reminder since it's clearly broken above its neckline at this point.

Wednesday, December 07, 2005

Battling the Decennial Pattern

There are only 16 trading days left in 2005.

As has been stated over and over again - particularly before the year began - 2005 is "fated" to be a positive year for the Dow because of the Decennial Pattern (e.g. years ending with 5 have, ever since the creation of the Dow in the late 19th century, had a positive return - - indeed, a VERY positive return).

Years ending with 7 and 0, by contrast, have done relatively poorly.

As a bear, I am wanting to snap this pattern. I want it to end this year, because (a) we'll never hear about it again! (b) it'll be a major psychological blow to the bulls, with whom we are engaged in this financial war.

Well where do things stand now? Let's take a retrospective with the most recent instances of the magical "5" years....

1975 - 38.3% return
1985 - 27.7% return
1995 - 33.5% return

Wow! Those are really impressive numbers. So how's it going, 2005?

2005 (to date) - 0.2% return.

Whoo-hoooo! A whole FIFTH of ONE percent! Wow! Considering risk-free CDs are paying twenty times that much, that's pretty weak, wouldn't you say?

But it's still a positive number! Yet again, the year's not over until the fat lady rings the closing bell at the NYSE.

Stay tuned. The magic number of Dow 10,783. Above that, the bulls have bagged another one. Below it - - - you won't be able to shut me up.

Sunday, December 04, 2005

The Windup......and the Pitch!

As a new trading week approaches, most of the talk is about crossing Dow 11,000 (as if this is unprecedented; we were last there in June 2001). Clearly, given the market's strength since October 11th, it would be a psychological boost to the bulls to cross this threshold.

It could well happen. In fact, given the market chatter, it seems almost a foregone conclusion. But what if it does? What next?

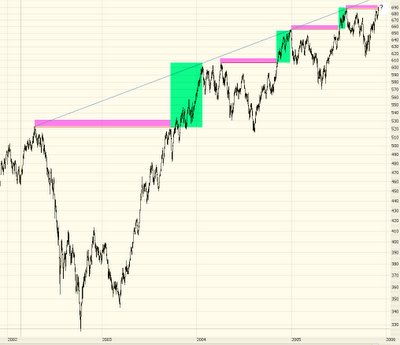
There have actually been a number of breakouts over the past few years, and it pays to take a look at their respective "windups" (the amount of time they were forming before they broke out) and "pitches" (just how much oomph was in the breakout).

I offer below the Russell 2000 for the past three and a half years. I've taken the liberty of illustrating each major breakout, showing the length of time (in purple) and the subsequent rise upward (in green). Click on the image for a bigger version.


You've probably noticed a pattern already. With each successive breakout, the length of time gets shorter, and the subsequent strength (and its longevity) gets weaker.

I put these figures into a spreadsheet, and here are the results:

Breakout One - 522 Days - 15.13% rise
Breakout Two - 216 Days - 8.07% rise
Breakout Three - 187 Days - 4.88% rise
Breakout Four - 120 Days - ??? rise

The breakout (if we agree to call it such) just took place on December 1st. If past patterns are any guide, if the breakout holds, the rise we may see is a relatively wimpy 2.44%.

But more important is this - - the trend will eventually change. It is inevitable. No market keeps going up forever, and eventually, a broad uptrend becomes a broad downtrend. And how does that happen? By a market ceasing to make new higher highs and instead making lower lows.

So when a breakout fails - - when the pattern breaks - - then the trend, ipso facto, can change. So has the trend changed yet? I have no idea. But one thing is clear - if the past several years are any guide, even if the Dow breaks 11,000 and the markets keep heading higher, there sure isn't a lot of windup behind this particular pitch.