Tuesday, April 26, 2005

Blast From the Past

The market continues to slowly turn from upward to downward. This isn't a one day event. It's like turning the Queen Elizabeth around. But it's happening.

I look at a lot of charts, and I can't remember such a "technical analysis friendly" market as this one. I noticed something amazing yesterday, however. Check out this chart of the MDY (which is the S&P 400 MidCap). I've provided some arrows to illustrate my point.


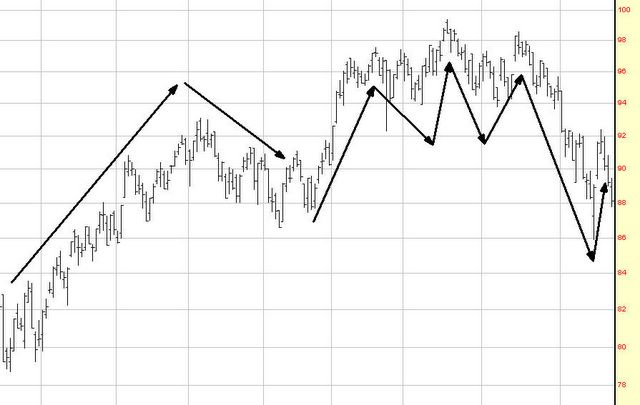
Got it? Now look at this one.


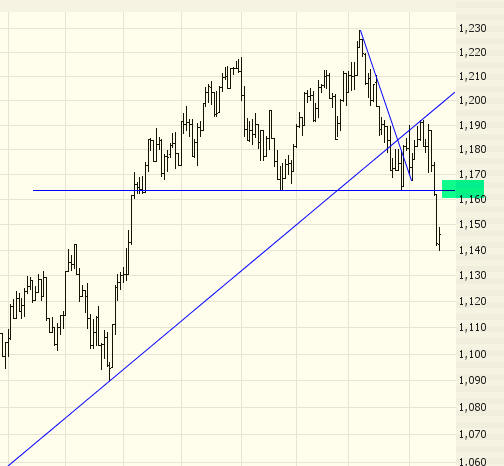
The scaling differences distort things a little, but I think you'll agree that these charts are essentially identical. A rapid rise followed by a perfect head & shoulders pattern, a break beneath the neckline, a recovery, and a subsequent collapse.

Now I'll tell you what you are looking at: the first chart is the MDY from February to June of 2002. And the second one is from right now. Specifically, November 2004 until the present day.

The key fact is this: the aftermath of the pattern shown in 2002 was a 30% drop in the market. And frankly, we're a lot higher now than we were then. Draw your own conclusions. But if history repeats itself, it's time to short as much MDY as one can afford.

Friday, April 22, 2005

So Far, So Good


At the start of this week, I said The market has gotten pummeled, and it's going to recover. Maybe for a day. Maybe two. Or three. Or even a week. But it's only going to retrace to the zone (shown in this picture on the $SPX shaded in green) representing the 'neckline'.

Well, that's exactly what has happened so far. I drew the green zone at 1,600 on the $SPX. And what was the intraday day high both Thursday and Friday? 1,595.95. That's right - 5 hundreths of a point below 1,600.

Not that it hasn't been nervewracking. The Dow's 200+ point rise on Thursday doesn't bring joy to a bear's heart. But - again - this is exactly what I was expecting to see.

Next week is going to be critical. If the $SPX stays beneath 1,600 - hopefully, plunging to new lows - everything's set for a continued slump. If the market finds renewed strength from somewhere, it may alter the analysis. This is the most friendly market for technical analysis I can remember (in other words, everything seems to be working perfectly), so I'm optimistic.

Monday, April 18, 2005

What's Next


Although I completely and utterly missed a golden opportunity to make enough money last week to pay off the debt of some small nations, I believe I have a pretty clear idea what's about to happen with the market (side note: what I'm talking about is that I had buckets of puts on the SPX and selected stocks, and every single one of them skyrocketed in value after I closed the position. Anyway.)

The market has gotten pummeled, and it's going to recover. Maybe for a day. Maybe two. Or three. Or even a week. But it's only going to retrace to the zone (shown in this picture on the $SPX shaded in green) representing the 'neckline'. And once it retraces, and once the $VIX settles back - - - then all hell is going to break lose. I don't know what event will be used as the excuse for it. But it's going to get trampled. And hopefully I can recover some of the pride I lost last week by letting that huge fish (OK, it was a whale) get away.

Even though the $SPX isn't a head & shouders pattern, the market is absolutely filled with them. I've never seen so many of these patterns at once. My short candidates (for when the market finishes retracing) are as follows; some of these are head & shoulders, and some have broken major uptrends:

ASEI
ATI
BNI
CELG
CNI
CRS
CTSH
CZR
GD
HET
IIVI
IJR
IVGN
JLL
MAR
MGG
MOS
MVL
NC
NSC
NVR
PHS
TBL
TTC
UB
VMC
VTIV

Thursday, April 14, 2005

SPX Puts Go Mad (and so do I)


Well, this is proof that not every entry on this site is about how well my trades have gone!

I have been quite bearish on the market. A couple of days ago (yep, just two short days) I decided the market was getting oversold, so I cleared out of all my puts and shorts. In particular, I had a whole suite of puts on the SPX, two of which were April expirations (which was today).

Long story short, in the past two days, these things went up SIXTEEN fold. The biggest fish are those that get away, aren't they?

Wednesday, April 13, 2005

Riding the bounces.


This may look phony, but honest, it's true. The market has been very volatile lately, and I've been fortunate enough to sense the turning points pretty well.

The graph shown here indicates my entry points (both short and long) for big index ETFS (SPY, DIA, QQQQ, IJR, MDY). I'm sort of on the sidelines for straight stock positions, but I'm making ample use of indexes. The bouncing up and down will eventually get broken (my belief is........to the downside) but for now it's good, clean fun. (Comment from the next day: yep, it got broken all right........to the downside.)

Tuesday, April 12, 2005

Escape Hatch


I entered this morning completely short - about 30 different positions. Lots of puts, lots of shorts, lots of exposure. The market was dropping again, but I was getting the sense that very short-term, the drop in the market had played out. So in just a few minutes I covered every single position I had and went completely flat into cash.

As you can see from this graph, I exited at the arrow, and it's a good thing I did. Minutes from the last fed meeting sent the market flying skyward.

Friday, April 08, 2005

Riding the Transports


I have recently taken a liking to shorting certain transportation stocks. Symbols include NSC, CNI, and BNI. The above is a close-up of NSC.

As you can see, there are two nice, clean supporting trendlines (well, formerly supporting). It took out the first one a couple of weeks ago. And it took out the lower one today (April 8th). I've covered this position for now (as well as my short and put for CNI) for a nice profit. If you look at $TRAN, you'll see it violated a major supporting trendline today as well.

Tuesday, April 05, 2005

AIG Yow-Hoo


This was dumb luck. And some analysis. Anyway, AIG had been getting smashed really badly over the past several weeks. It seemed to have reached a double bottom (notice how Friday and Monday's prices didn't go beneath $50).

So on Monday morning I gobbled up a ton of stock and calls. I drove into work, and blammo, the stock had soared thanks to Elliott Spitzer (see green highlighted area). I went ahead and got out of the whole position for a great profit. Thanks, Elliott!

Friday, April 01, 2005

The End of a Good Week

I remain 100% short the market right now (about 30 shorts and puts) and am fairly satisfied with my positions.

This morning I had a knot in my stomach as I saw the jobs report (and the reaction on the GLOBEX) since it was clear the market was going to spike higher. It did, and of course every single position got nailed.

What I found to be a huge relief though - and the magic of trendlines never fails to amaze me - is that the $SPX shot up toward the underbelly of the trendline it had broken earlier in the week, and it did not cross above it.