Broken to the Upside

Every chart tells a different story. The index charts these days are no different. You could look at $INDU, $SPX, $COMPQ, $NDX, $OEX, $UTIL, $TRAN, $RUT, $MID, etc. and discuss each of them differently. But let's focus on the Russell 2000, the $RUT (whose ETF equivalent is the IWM), since I've been writing about it most recently.
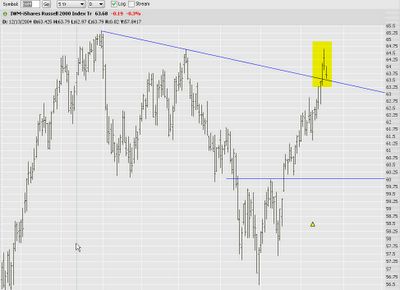
I pointed out last Wednesday, June 15th, that the IWM had finished the day in an extraordinary candlestick formation which was very bearish. Thursday's action negated that candlestick. The market opened higher, push through the descending trendline, weakening the case for the bears (like yours truly). To worsen matters, the next day IWM reached a high above its March 7th high, thereby negating a notion of a market reaching "lower highs" (in other words, a stair-step down pattern). It only got a penny above the March 7th high, but all the same, it pierced that former level. This does not make for the kind of market swoon a bear would want to see.
But the market isn't out to please either the bulls or the bears. It just does what it does. It is in a never-ending process of price discovery. It's up to us to try to anticipate what price it's going to discover next!
Today, Monday June 20th, the market did fall, but it did not fall beneath the trendline which was broken last week. This could be a set-up for further strength. Remember how trendlines switch the "support" and "resistance" coat. The descending trendline, formerly resistance, may now be support. IWM would have to fall beneath this trendline to negate this bullish set-up (and if it did, we might as well erase the trendline, because it's being hopped across so many times as to render it pointless).
Oh, one last thing before I close - check out ADEX. It's one of the few good looking bullish charts out there. A relatively conservative stop price on this issue would be $26.20.

No comments:
Post a Comment