
Finally, the Bounce
Well, that was predictable.
The bounce that everyone's been waiting for finally arrived. The Dow was up nearly 100 points, and there were bounces pretty much across the entire spectrum, including energy. The S&P 500 graph below (intraday) shows how the market was finally able to get some real strength.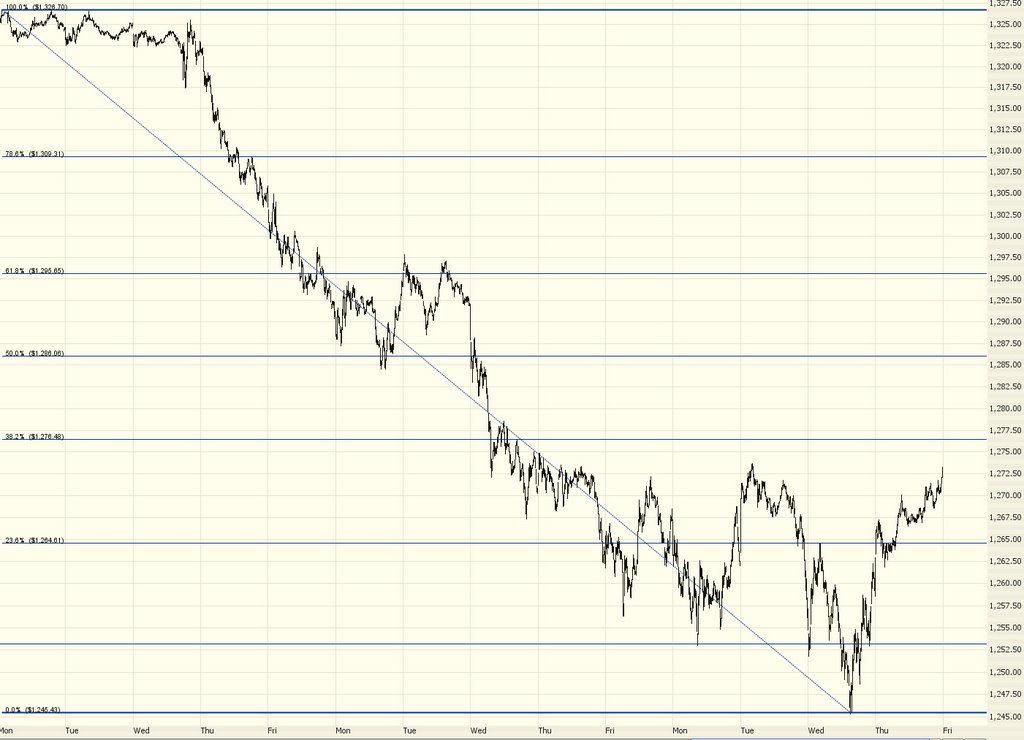
The horizontal lines represent Fibonacci retracement levels as measured from the early May highs to yesterday's lows.
If you look at the intraday graphs of the $INDU, $SPX, and $NDX, you can see fairly clearly where they "should" pause. I put should in quotes simply because markets don't always obey technical analysis, and there's no doubt I've been wrong before. If they do (a) pause there (b) reverse (c) take out the recent lows, then we'll have an honest to goodness bear market on our hands. And it'll be about time.
I'm going to keep this brief today, but I'll offer one nice looking chart to you for consideration of a short sale - CRR, Carbo Ceramics. A retracement anywhere close to $50 probably represents a nice low-risk/high-reward trade.
1 comment:
I really don't see a "bounce". What I see is that in 4 out of the last 5 days the INDU close higher than the open. It traded in a narrow range for 4 days before yesterday and yesterday it broke out of its narrow trading range.
Post a Comment